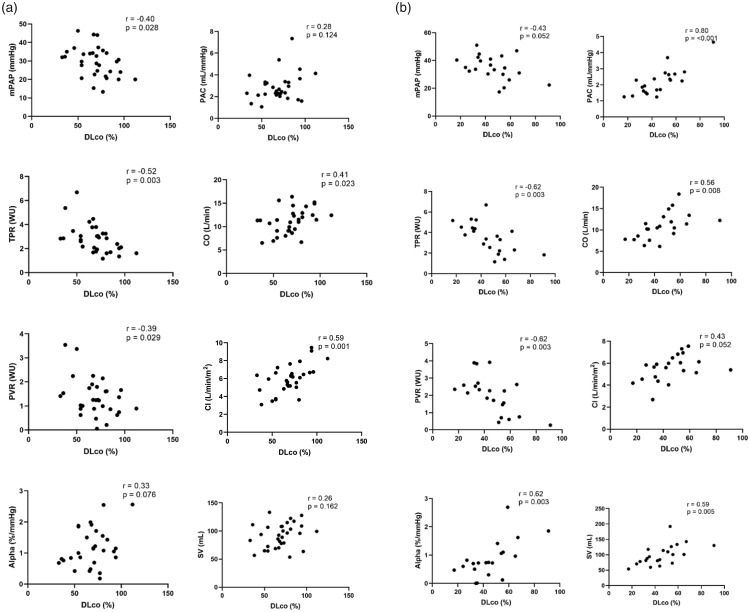
Fig. 3.
Peak hemodynamic and DLco% correlations. (a) Plots in patients without parenchymal lung disease. (b) Plots in patients with underlying parenchymal lung disease.
mPAP: mean pulmonary arterial pressure; PAC: pulmonary arterial compliance; TPR: total pulmonary resistance; CO: cardiac output; CI: cardiac index; PVR: pulmonary vascular resistance; DLco%: diffusing capacity of lungs for carbon monoxide; SV: stroke volume.

