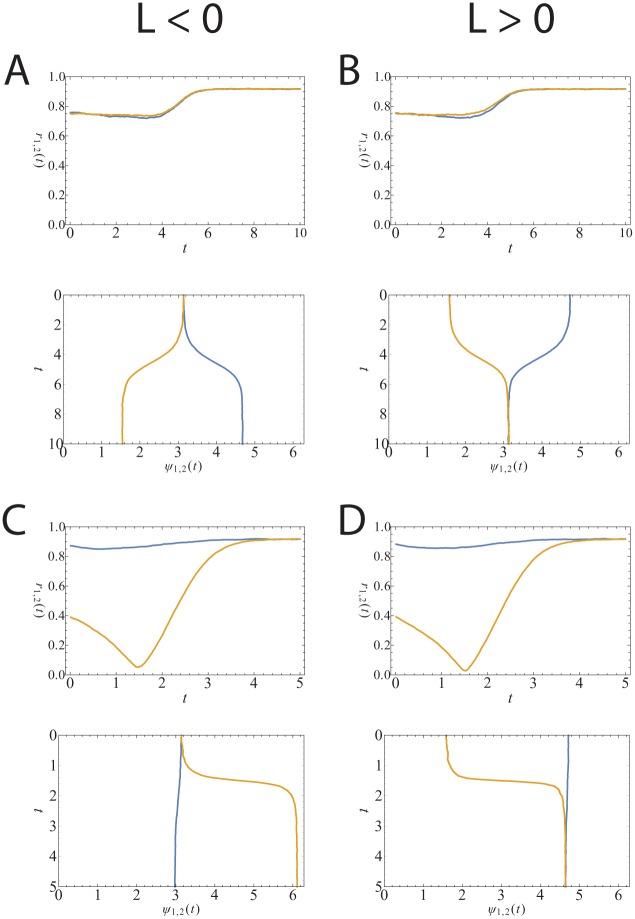
Figure 3.
Simulation of 10,000 oscillators per community with (A and C) or (B and D) and (A and B) or (C and D). The time step is set at . The top images show the synchronization levels ( and ) and the bottom the average phases ( and ). The phases are plotted in a way that the different communities can be seen as the 2 components of activity in the suprachiasmatic nucleus. The time on the y-axis can be regarded as consecutive days. (A) and (B) show the case in which and are the same, whereas (C) and (D) show the case in which they differ at first but both approach 1 when the stable state is reached.

