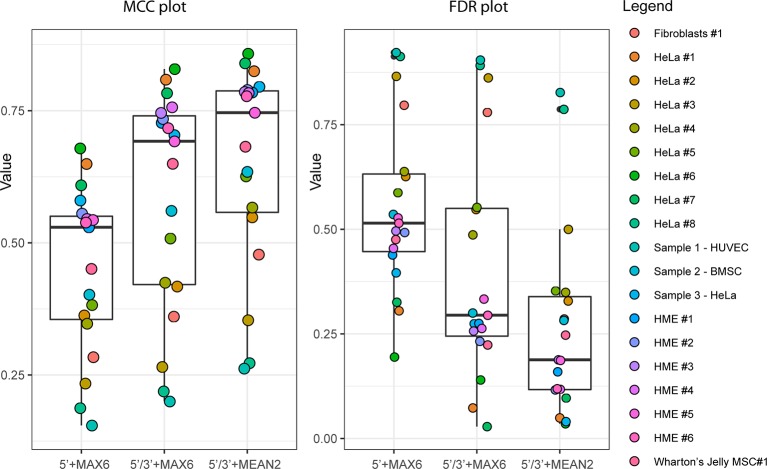
Figure 3.
Improvement of ScoreMAX/MEAN (MAX6 and MEAN2) with 5'/3'-counts and reduced calculation window (Score 2 calculation scheme). Boxplot shows max Matthews correlation coefficient (MCC) values (left) and associated false discovery rate (FDR) (right) for all 19 RiboMethSeq datasets used for validation. Identity of the RiboMethSeq datasets is given on the right.

