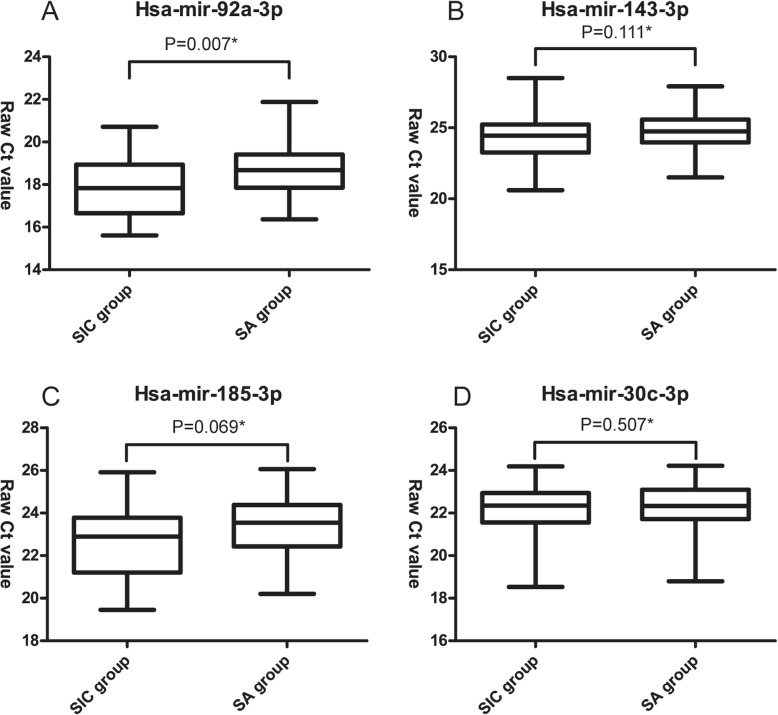
Fig. 1.
Comparisons of the levels of four miRNAs between SIC group (n = 34) and SA group (n = 52). a. Comparison of plasma hsa-mir-92a-3p between SIC and SA group, b. Comparison of plasma hsa-mir-143-3p between SIC and SA group, c. Comparison of plasma hsa-mir-185-3p between SIC and SA group, d. Comparison of plasma hsa-mir-30c-3p between SIC and SA group, * by Student’s t test, SIC = Sepsis-Induced Coagulopathy, SA = Sepsis-Along

