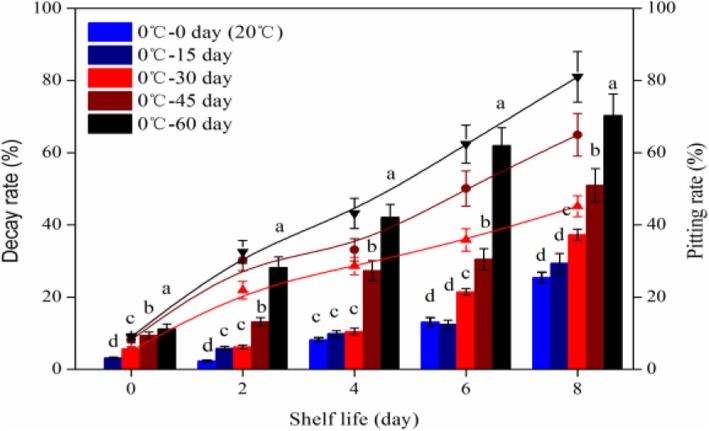
Fig. 2.
Changes of pitting and decay rates at shelf-life (20 °C) after different storage time at 0 °C. The lines indicate the pitting rate and the column diagram indicate the decay rate. Each value is the mean of three replicates of 150 fruits (P < 0.05). The error bars show the SD of the means (n = 3; three biological replicates, each with three technical replicates)

