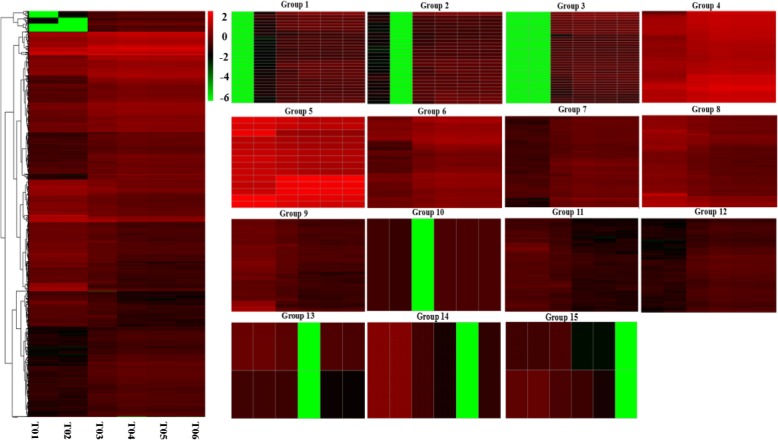
Fig. 6.
Thermal maps of DEGs and 15 clusters produced for thermographic analysis. Different columns represent different samples and different rows represent different genes. Each small square represents a gene and the color indicates the level of expression; red represents up-regulation and green represents down-regulation

