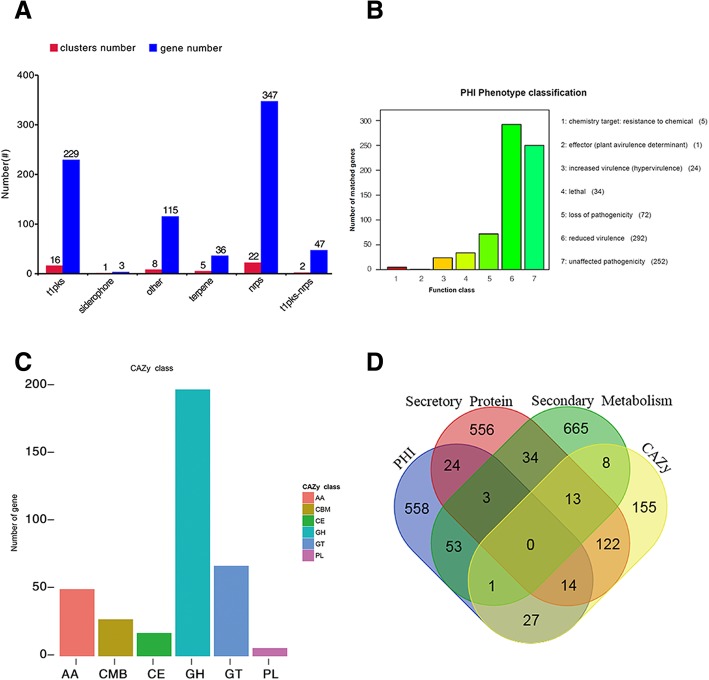
Fig. 1.
Gene annotation and gene prediction of C. sojina Race15. a Genes were predicted to be related to Secondary Metabolism. Red bar represents the clusters number, and blue bar represents the number of genes. b Genes were annotated and classified in the PHI database. Bars in different color represent different PHI function classes, and lengths represent the number of genes. c Genes were annotated and classified in the CAZy database. Bars in different colors represent different CAZy categories, and length represents the number of genes. d Venn diagram showing the overlap of PHI-homologues and secretory proteins with secondary metabolites and CAZymes

