
Figure 7.
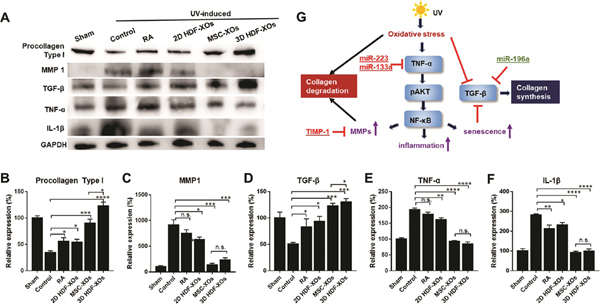
Antiphotoaging mechanism signaling pathway analysis. (A) Western blot of dorsal skin of different groups. (B–F) Quantification of procollagen 1, MMP1, TGF-β, TNF-α, and IL-1β (n = 3); n.s. means no significant difference, *p < 0.05, **p < 0.01, ***p < 0.001, ****p < 0.0001. (G) Schematic illustration of the mechanism of 3D HDF-XOs treatment.