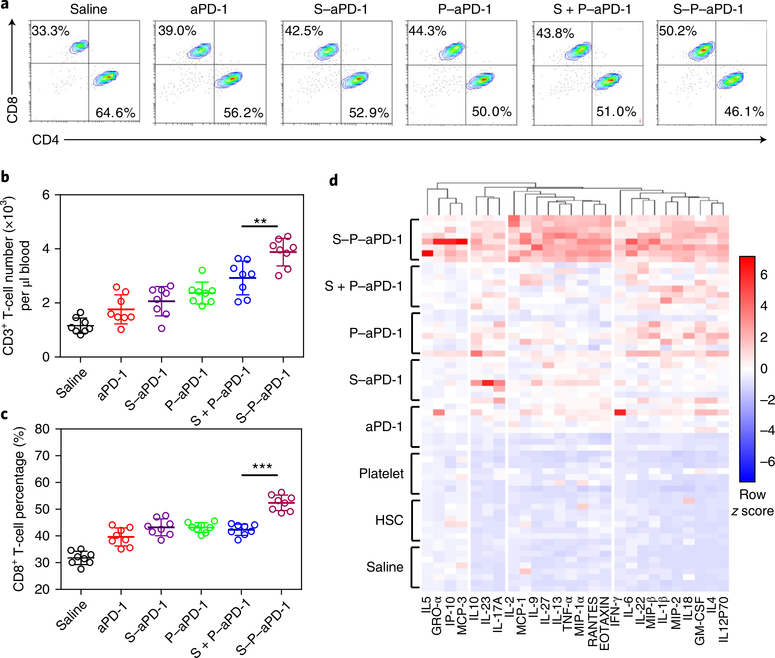
Fig. 3 |. Analysis of t cells, cytokines and chemokines.
a, Flow cytometry analysis of CD8+ T cells (gated on CD3+ T cells) in peripheral blood. The experiments were repeated three times. b, Quantitative analysis of the number of CD3+ T cells. Data are presented as means ± s.d. (n = 8). ** P = 0.0048, one-way ANOVA, followed by Tukey’s HSD post hoc test. c, Quantitative analysis of the percentage of CD8+ T cells. Data are presented as means ± s.d. (n = 8). ***P < 0.0001, one-way ANOVA, followed by Tukey’s HSD post hoc test. d, Luminex-based quantification of cytokines and chemokines (n = 8).

