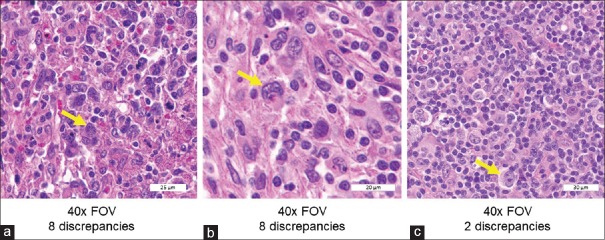
Figure 10.
Extracts from the three FOVs with Reed–Sternberg cells. FOVs in A and B had eight study discrepancies each, whereas C had only two discrepancies. (a) Several atypical-appearing cells, one of which was classified as a Reed–Sternberg cell (arrow) by the Medical Director, representing the best example in the selected case (×40). (b) The second FOV from a different case at higher magnification (×40), with indicated Reed–Sternberg cell having atypical nuclear features. (c) Had typical Reed–Sternberg cells (×40). FOVs: Fields of view

