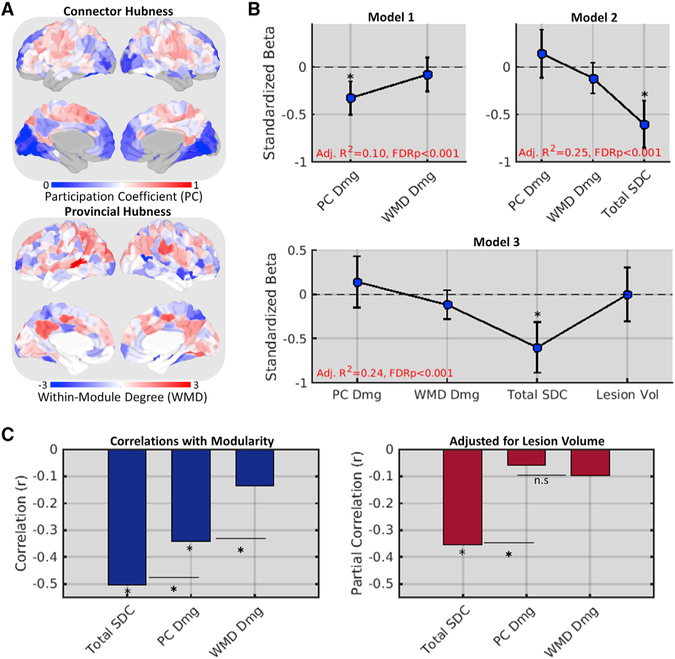
Figure 2. Total Disconnection Is Superior to Cortical Hub Damage for Explaining Reduced Modularity.
(A) FC participation coefficients (top) and within-module degree Z scores (bottom) for each cortical region in the mean control FC matrix.
(B) Standardized betas (y axes) for structural measure predictor effects (x axes) from three nested regression models of network modularity in the patient group (n = 114). Error bars correspond to 95% CIs.
(C) Correlations (left, y axis) and partial correlations (right, y axis) between structural measures (x axes) and modularity. *FDR, p < 0.05.
See also Figure S2.

