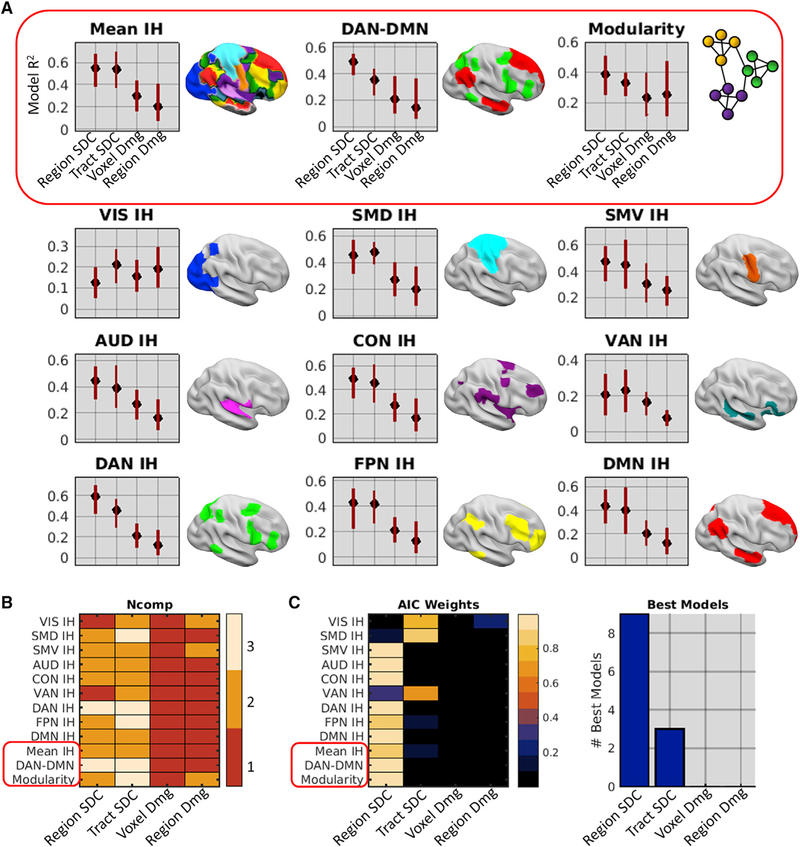
Figure 3. Disconnection Provides the Best Anatomical Account of Network Dysfunction After Stroke.
(A) PLSR model fits and family-wise error (FWE)-corrected 95% CIs. Plots show R2 values (y axes) for different anatomical models (x axes) of each FC measure obtained from the patient group (n = 114).
(B) Number of components included in each anatomical model (x axis) of each FC measure (y axis) as determined by jackknife cross-validation.
(C) Left: model AIC weights for each anatomical model (x axis) of each FC measure (y axis). Right: number of times (y axis) each anatomical model (x axis) was selected as the best model of the set. The red boxes highlight distinct core FC disruptions.
See also Figures S2 and S3.

