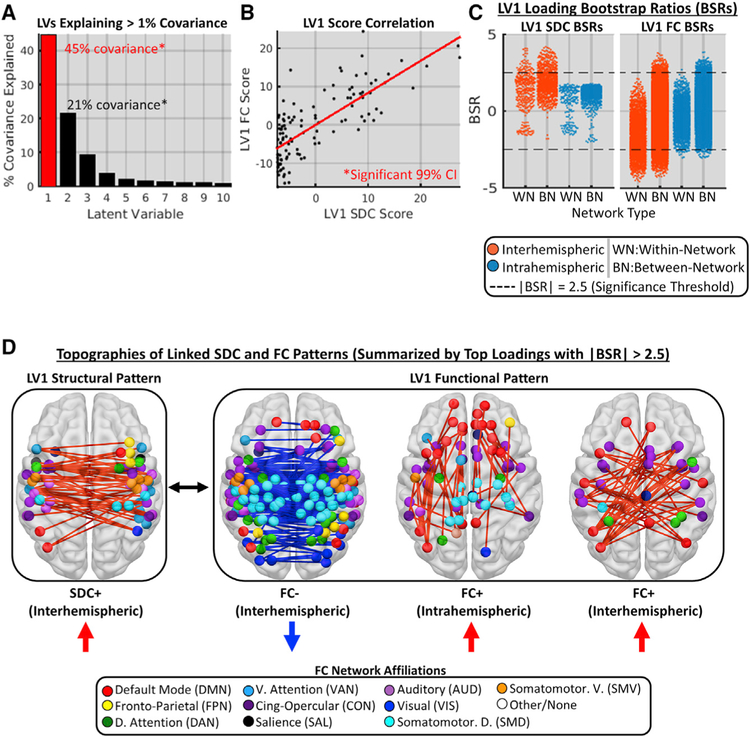
Figure 5. Low-Dimensional Covariance of Disconnection and Functional Connectivity Patterns.
(A) Proportion of total covariance explained by 1st 10 LVs from the PLSC of SDC and FC patterns in the patient group (n = 114). LV1 (red outline) is characterized in subsequent panels.
(B) Relationship between patient SDC (x axis) and FC (y axis) scores for LV1.
(C) LV1 SDC (left plot) and FC (right plot) BSRs (y axes) for different connection type categories (x axes). Dots correspond to individual connections. Dashed lines denote significance thresholds.
(D) Multivariate SDC and FC topographies linked by LV1. Brain images show top 20% of significant positive (shown in red) and negative (shown in blue) loadings for SDC and FC patterns with significant BSRs (i.e., data points above and/or below dashed lines in C).
See also Figures S6 and S7.

