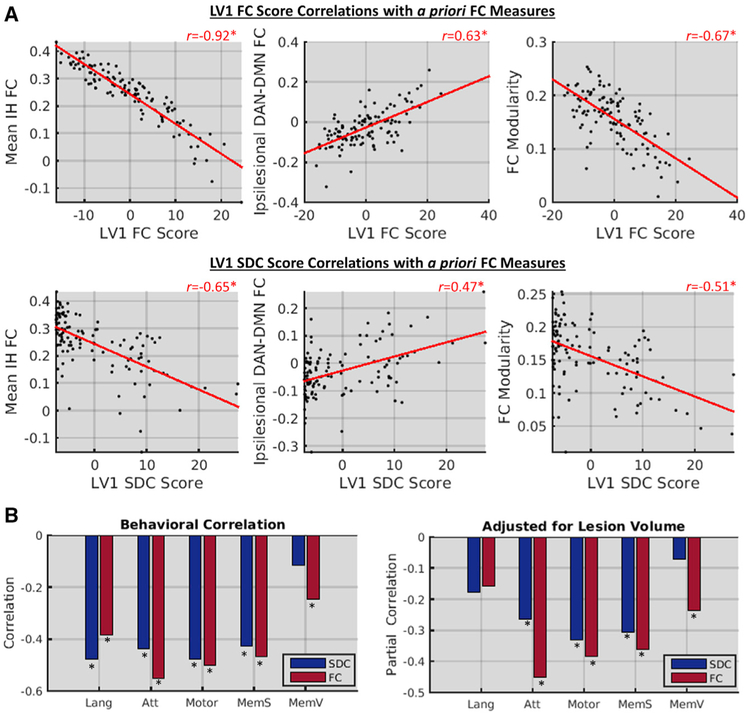
Figure 6. LV1 Underlies Core Functional Connectivity Disruptions and Correlates with Behavior.
(A) Scatterplots show relationships between core FC disruptions (y axes) and LV1 FC (top row) and SDC (bottom row) scores (x axes) in the patient group (n = 114).
(B) Bar plots show raw (left plot) and partial (right plot) correlations (y axes) between behavioral measures (x axes) and LV1 scores. Lang, language; Att, attention; MemV, verbal memory; MemS, spatial memory. *FDR, p < 0.05.

