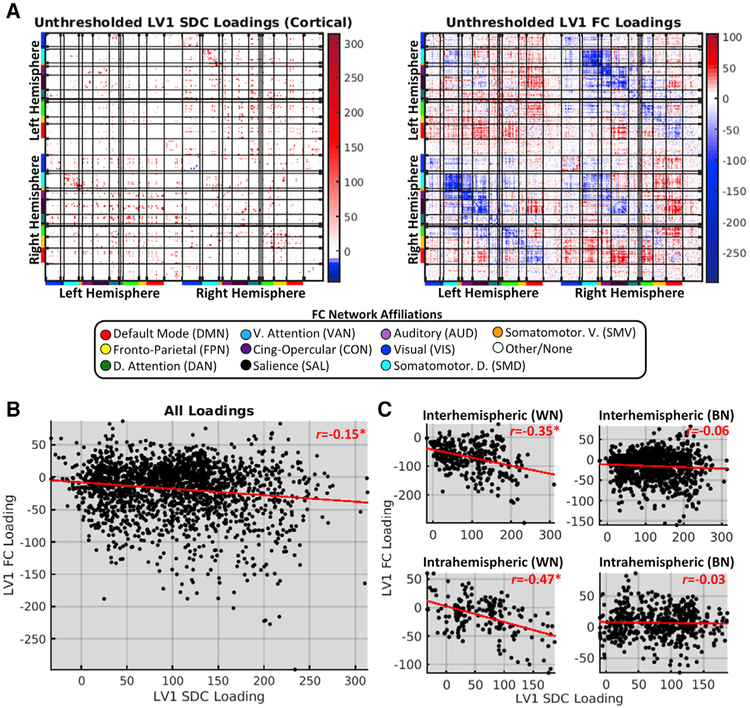
Figure 7. Disconnection Topographies Are Partially Reflected in Functional Connectivity Patterns.
(A) Unthresholded LV1 SDC (left; cortical only) and FC (right) loadings obtained from PLSC of data from the patient group (n = 114). Matrices are organized as in Figure S2.
(B) Relationship between LV1 SDC (x axis) and FC (y axis) loadings.
(C) Relationships for different connection type categories (WN, within-network; BN, between-network). *FDR, p < 0.05.
See also Figures S6 and S8.

