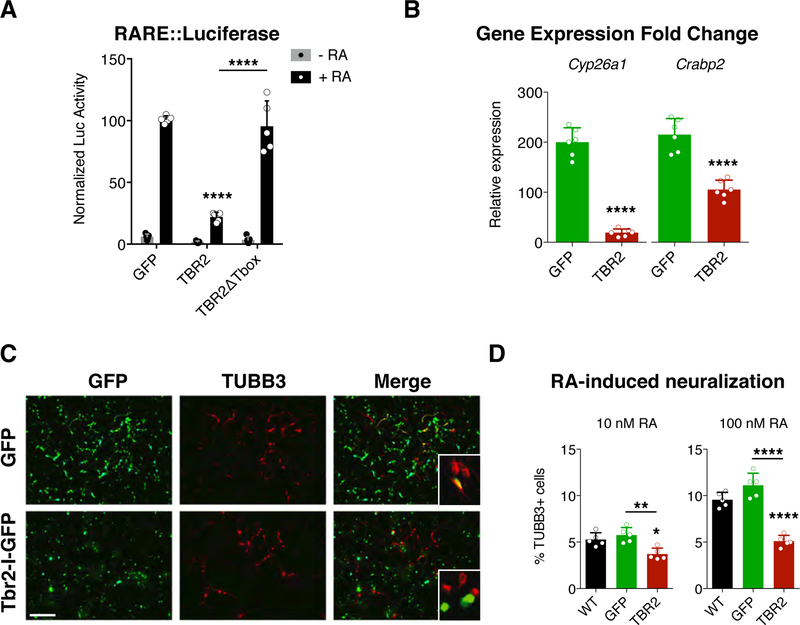
Fig. 1. TBR2 moderates retinoic acid response in vitro.
(A) Luciferase assays for the activation of the retinoic acid responsive element (RARE) in P19 cells reveal a strong downregulation induced by TBR2 when retinoic acid (RA) is added to the media (black bars) while no effect is present without RA (grey bars); this effect is abolished removing the Tbox domain from TBR2. Quantification shown as mean + S.D. with dots representing the five biological replicates (independent cell lysates) (each is the mean of five measurements, technical replicates): -RA, GFP vs TBR2 p = 0.9738, GFP vs TBR2∆Tbox p = 0.9979, TBR2 vs TBR2∆Tbox p = 0.999; +RA, GFP vs TBR2 **** p < 0.0001, GFP vs TBR2∆Tbox p = 0.9023, TBR2 vs TBR2∆Tbox p < 0.0001. All measurements statistically compared using two-way ANOVA, Sidak’s multiple comparisons test. (B) Histograms reveals the expression fold change, obtained by RT-qPCR, of the Cyp26a and Crabp2 genes when RA is added to the medium compared whit the RA-free medium for GFP transfected (green bars) and TBR2 transfected (red bars) cells. Quantification shown as mean + S.D. with dots representing the six biological replicates (independent RNA) (each is the mean of four PCR, technical replicates): Cyp26a, **** p < 0.0001; Crabp2, **** p < 0.0001. All measurements statistically compared using unpaired t test. (C) Immunocytochemistry for GFP and βIII-tubulin (TUBB3) on P19 cells, transfected with GFP mock or Tbr2, after 4 days of RA-induced neural differentiation (10 nM); bar = 100 µm. (D) Graph shows the counts for the βIII-tubulin+ cells among all nuclei for the wild-type condition (black bar) and for all GFP+ (green bar) or Tbr2-transfected (red bar) cells over the GFP− un-transfected cells using 10 nM and 100 nM of RA. Quantification shown as mean + S.D. with dots representing the five biological replicates (independent differentiations) (each is the mean of four quantifications, technical replicates): 10 nM, WT vs GFP p = 0.5612, WT vs TBR2 * p = 0.0132, GFP vs TBR2 ** p = 0.0021. 100 nM, WT vs GFP p = 0.5630, WT vs TBR2 **** p < 0.0001, GFP vs TBR2 **** p < 0.0001. All measurements statistically compared using one-way ANOVA, Tukey’s multiple comparisons test.

