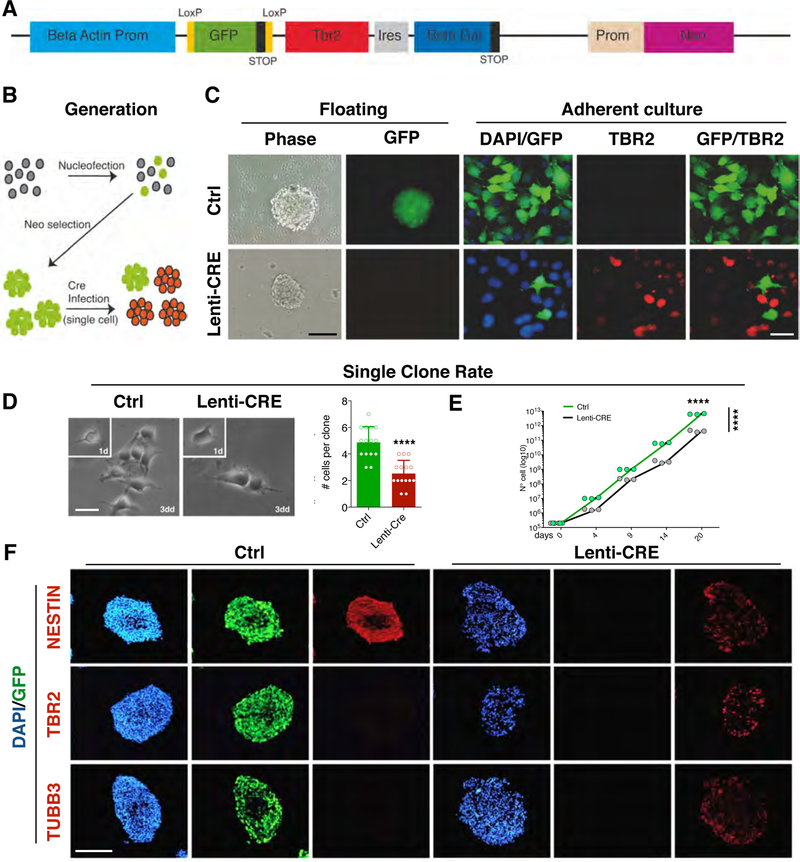
Fig. 2. Generation and characterization of Tbr2 Cre inducible transgenic neural stem cell lines.
(A) Drawing of the construct for the conditional expression of Tbr2 where the Tbr2-IRES-GFP sequence is downstream to a constitutive promoter followed by a floxed GFP-Stop cassette. A Neomycin resistance cassette is also included. (B) Schematic representation of the generation of transgenic neural stem cells (NSCs). Wild-type NSCs from E14.5 cerebral cortices are propagated as neurospheres and nucleofected with the Tbr2 conditionally-expressing construct and selected for Neomycin resistance. When the population is composed by only GFP+ cells, then, a single infection with Cre-expressing or mock lentivirus is performed to induce the excision of GFP and release expression of Tbr2. (C) Neurospheres grown after a pulsed Cre expression showing the loss of the GFP fluorescent signal; immunocytochemistry on either mock or Cre-infected NSCs for GFP and TBR2 showing the strong activation of Tbr2 concomitant with the GFP downregulation; bars = 100 µm (left), 20 µm (right). (D) Neurospheres from both conditions were dissociated and plated in adhesion at single cell density to evaluate proliferation at single clone level. After three days in culture the Tbr2-overexpressing clones showed a decrease in clonal dimension as show in graph (Ctrl: 4.87±1.9% vs Tbr2-overexpressing: 2.53±0.9%). Quantification shown as mean + S.D. with dots representing 15 clones per condition, **** p < 0.0001. All measurements statistically compared using unpaired t test. bar = 10 µm. (E) The growth curve on bulk NSC cultures indicates that Tbr2-overexpression reduces cell growth (black line) compared to the control NSCs (green line). Quantification (shown as growth curve that links mean with dots representing individual samples): n = 3, day 20 **** p < 0.0001, differences between groups: F1,20 = 449.2, **** p < 0.0001; all measurements statistically compared using two-way ANOVA, Sidak’s’s multiple comparisons test. (F) Immunocytochemistry on cryostat section of neurospheres for the NSC marker NESTIN, TBR2 and the neuronal marker βIII-tubulin (TUBB3), shows that the control GFP+ NSC are exclusively NESTIN+, with no signal for TBR2 or TUBB3. Conversely, in Cre-infected NSCs TBR2 expression is activated and NESTIN staining is decreased while TUBB3 expression is turned on indicating premature neuronal differentiation; bar = 100 µm.

