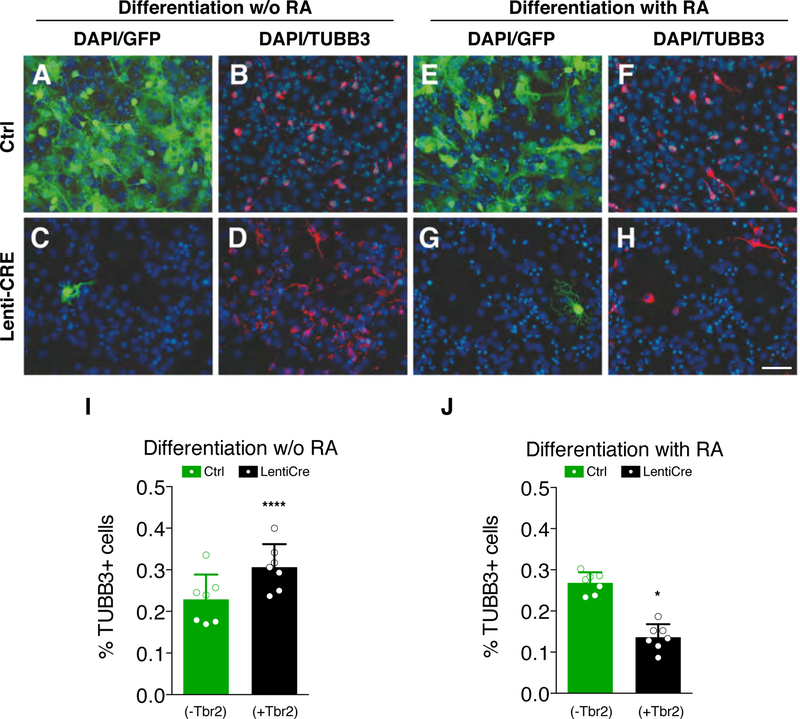
Fig. 3. TBR2 reduces RA-induced neural differentiation.
(A-D) Immunocytochemistry for GFP (A and C) and βIII-tubulin (TUBB3, B and D) on wild-type (A and B) and Cre-infected (C and D) NSCs after 10 days of culture in the differentiation medium without RA. (E-H) Immunocytochemistry for GFP (E and G) and βIII-tubulin (TuJ1, F and H) on wild-type (E and F) and Cre-infected (G and H) NSCs in the same culture medium usupplemented with RA for 10 days; bar = 50 µm. (I) Graph shows counts for TUBB3+ neurons in RA-free medium. Control, GFP+/TBR2− cells (green bar): 22.87±5.9% TUBB+/GFP+ vs GFP+/TBR2− (black bar): 30.64±5.5% TUBB3+/GFP−/DAPI+. Quantification shown as mean + S.D. with dots representing the seven biological replicates (independent differentiations) (each is the mean of three quantifications, technical replicates): **** p < 0.0001. All measurements statistically compared using unpaired t test. (L) Counts for TUBB3+ neurons in RA supplied medium. Control, GFP+/TBR2− cells (green bar): 26.82±2.6% TUBB3+/GFP+ vs GFP+/TUBB3− (black bar): 13.62±3.2% TUBB3+/GFP−/DAPI+. Quantification shown as mean + S.D. with dots representing the seven biological replicates (independent differentiations) (each is the mean of three quantifications, technical replicates): * p = 0.0267. All measurements statistically compared using unpaired t test.

