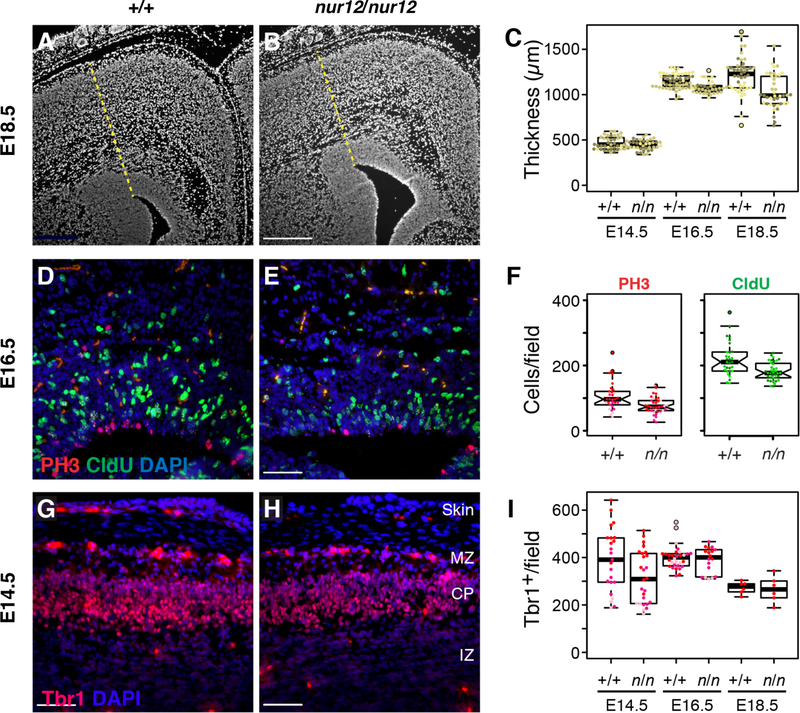
Figure 7. Endogenous Zfp423 is required for normal cortical development.
(A-B) Zfp423 null (nur12, n in figure) cortex appears thinner than control by E18.5. Radial thickness of developing cortex was measured radially from the dorsal exterior tip of the ventricle (yellow dashed line) for littermate samples sectioned at matched rostral caudal levels. Scale bar, 500 µm. (C) Graphs summarize replicate measures from three littermate pairs at each of three ages. Littermates are encoded by color intensity. Paired measurements averaged 15% thinner cortex in mutant samples at E18.5, with a trend toward thinner cortex (6%) at E16.5. (D-E) Zfp423 null (nur12) cortex shows less proliferation of neural precursors at E16.5. Frequencies of PH3 immunoreactivity and 1hr. CldU incorporation were monitored in alternate sections from the same animals in (C). Representative fields are shown. Scale bar, 100 µm. (F) Distribution of counts per field at E16.5 are shown. Pooled across all ages, number of positive cells per field were not normally distributed, but significant by non-parametric Wilcoxon rank sum tests for PH3 (p=0.003), CldU (p=0.05), either label (p=0.03), and double-positive cells (p=0.007). Significance was uniquely attributable to differences at E16.5 (p=0.002, 0.0006, 0.0004, and 0.007, respectively), accounting for 17% fewer proliferating cells in mutants at this age. (G-H) Matched sections from the same animals were stained for TBR1 expression (red). Indicated layers are marginal zone (MZ), cortical plate (CP) and intermediate zone (IZ). (I) Numbers of TBR1+ nuclei per field were significant across the full data set (p=0.027, ANOVA). Although no single age was independently significant by genotype after correcting for multiple comparisons, a 19% difference at E14.5 approached conventional significance (p=0.06, Tukey HSD).

