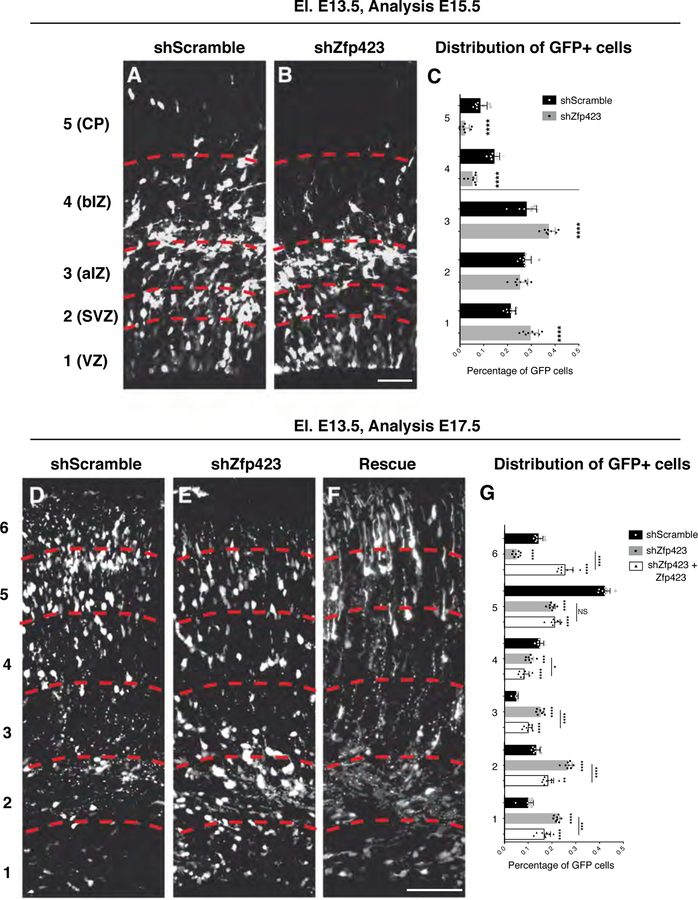
Fig. 9. In vivo Zfp423 downregulation impairs neuronal maturation and migration.
(A-B) GFP immunolabelled coronal sections of E15.5 developing cortices targeted at E13.5 with control shRNA (shScramble) (A), Zfp423 shRNA (B). Sections were subdivided (red dashed lines) in five bins from apical to basal side to evaluate the radial migration of the GFP+ cells; bar = 50 µm. (C) The graph represents the percentage of GFP+ in each bin on the total for control (black bars) or knock down experiments (gray bars) shown as mean + S.D. with dots representing the eight biological replicates (independent electroporated embryos) (each is the mean of 3 quantification, technical replicates): bin 1 (VZ) **** p < 0.0001, bin 2 (SVZ) p = 0.2016, bin 3 (apical IZ) **** p < 0.0001; bin 4 (basal IZ) **** p < 0.0001, bin 5 (CP) **** p < 0.0001. All measurements statistically compared using unpaired t test. (D-F) GFP stained coronal sections of E17.5 developing cortices targeted at E13.5 with control shRNA (shScramble) (D), Zfp423 shRNA (E) or Zfp423 shRNA + Zfp423 full length (F). Sections were subdivided (red dashed lines) in six parts from apical to basal side to evaluate the migration of GFP+ cells; bar = 100 µm. (G) The graph represents the percentage of GFP+ in each bin on the total for control (black bars), knock down (gray bars) or rescue experiments (empty bars) shown as mean + S.D. with dots representing the eight biological replicates (independent electroporated embryos) (each is the mean of 3 quantification, technical replicates): bin 1: shScramble vs shZfp423 **** p < 0.0001, shScramble vs shZfp423+Zfp423 **** p < 0.0001, shZfp423 vs shZfp423+Zfp423 *** p = 0.0002; bin 2: shScramble vs shZfp423 **** p < 0.0001, shScramble vs shZfp423+Zfp423 ** p = 0.0012, shZfp423 vs shZfp423+Zfp423 **** p < 0.0001; bin 3: shScramble vs shZfp423 **** p < 0.0001, shScramble vs shZfp423+Zfp423 **** p < 0.0001, shZfp423 vs shZfp423+Zfp423 **** p < 0.0001; bin 4: shScramble vs shZfp423 *** p = 0.0007, shScramble vs shZfp423+Zfp423 **** p < 0.0001, shZfp423 vs shZfp423+Zfp423 * p = 0.0373; bin 5: shScramble vs shZfp423 **** p < 0.0001, shScramble vs shZfp423+Zfp423 **** p < 0.0001, shZfp423 vs shZfp423+Zfp423 p = 0.5628; bin 6: shScramble vs shZfp423 **** p < 0.0001, shScramble vs shZfp423+Zfp423 **** p < 0.0001, shZfp423 vs shZfp423+Zfp423 **** p < 0.0001; all measurements statistically compared using two-way ANOVA, Tukey’s multiple comparisons test.

