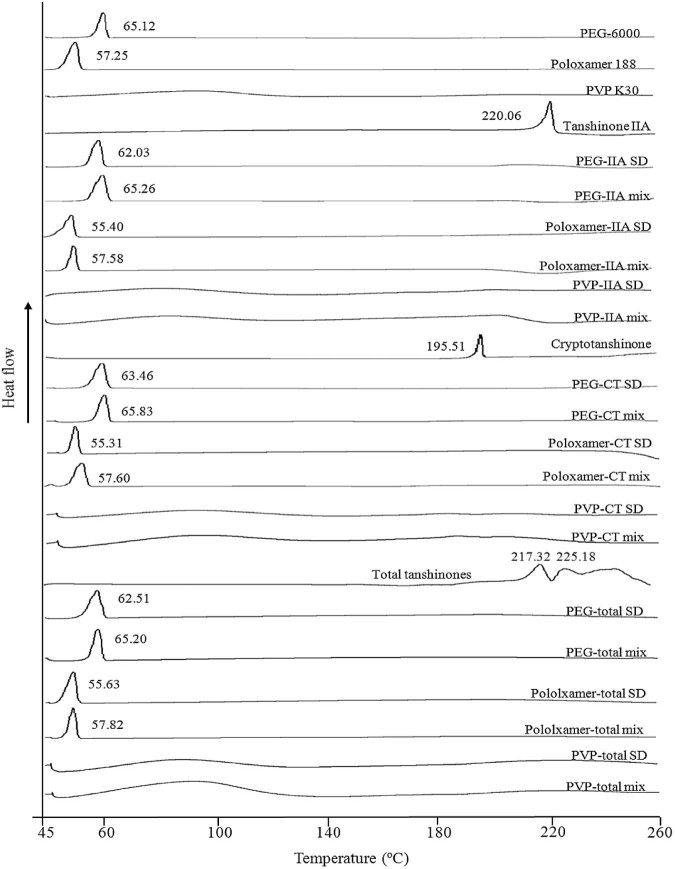
Fig. 8.
DSC thermograms of raw materials, solid dispersions and physical mixtures (1:6 w/w). From the bottom: PVP K30-total tanshinones physical mixture (PVP-total mix), PVP K30-total tanshinones solid dispersion (PVP-total SD), poloxamer 188-total tanshinones physical mixture (poloxamer-total mix), poloxamer 188-total tanshinones solid dispersion (poloxamer-total SD), PEG 6000-total tanshinones mixture (PEG-total mix), PEG 6000-total tanshinones solid dispersion (PEG-total SD), total tanshinones, PVP K30-cryptotanshinone physical mixture (PVP-CT mix), PVP K30-cryptotanshinone solid dispersion (PVP-CT SD), poloxamer 188-cryptotanshinone physical mixture (poloxamer-CT mix), poloxamer 188- cryptotanshinone solid dispersion (poloxamer-CT SD), PEG 6000-cryptotanshinone mixture (PEG-CT mix), PEG 6000-cryptotanshinone solid dispersions (PEG-CT SD), pure cryptotanshinone (cryptotanshinone, PVP K30-tanshinone IIA physical mixture (PVP-IIA mix), PVP K30-tanshinone IIA solid dispersion (PVP-IIA SD), poloxamer 188-tanshinone IIA physical mixture (poloxamer-IIA mix), poloxamer 188-tanshinone IIA solid dispersion (poloxamer-IIA SD), PEG 6000-tanshinone IIA mixture (PEG-IIA mix), PEG 6000-tanshinone IIA solid dispersion (PEG-IIA SD), pure tanshinone IIA (Tanshinone IIA), PVP K30, poloxamer 188 and PEG 6000.

