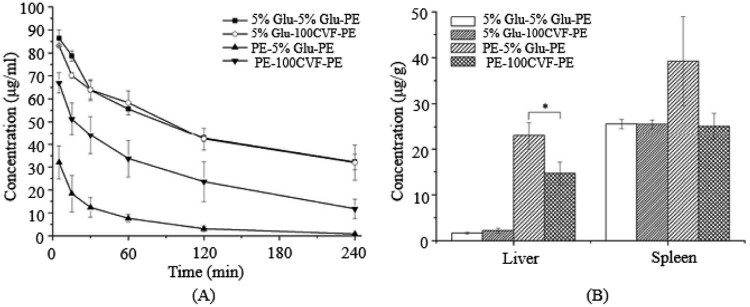
Fig. 4.
The blood clearance profile and tissue distribution after i.v. injection of PE in rats. Each group received i.v. injections of 5% glucose solution or CVF (100 µg/kg) 1 d before the PE treatment. (A) Blood clearance and (B) hepatic and splenic accumulation 4 h after i.v. injection of the test dose. Data are shown as mean ± S.D., n = 3. P values apply to differences between the 5% glucose solution treated and CVF (100 µg/kg) treated rats before the second dose.*P < 0.05, **P < 0.01, ***P < 0.001.

