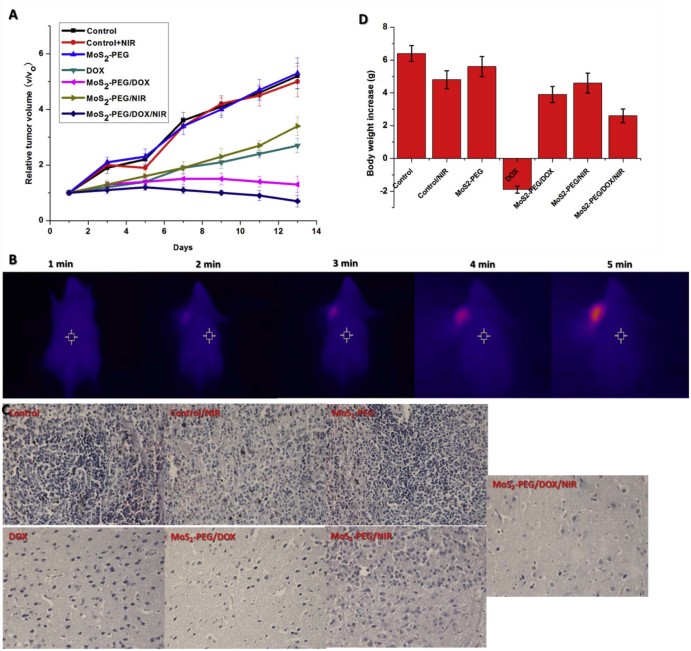
Fig. 13.
In vivo treatments (A) Tumor growth of mice in different treatment groups within 14 days; (B) Increased temperature in tumor under NIR radiation (808 nm, 2 W/cm2); (C) H&E stained tumor tissues harvested from the mice with different treatments (40×) and (D) Changes of body weight of mice in different groups during treatment. Data were presented as mean ± standard deviation (n = 6).

