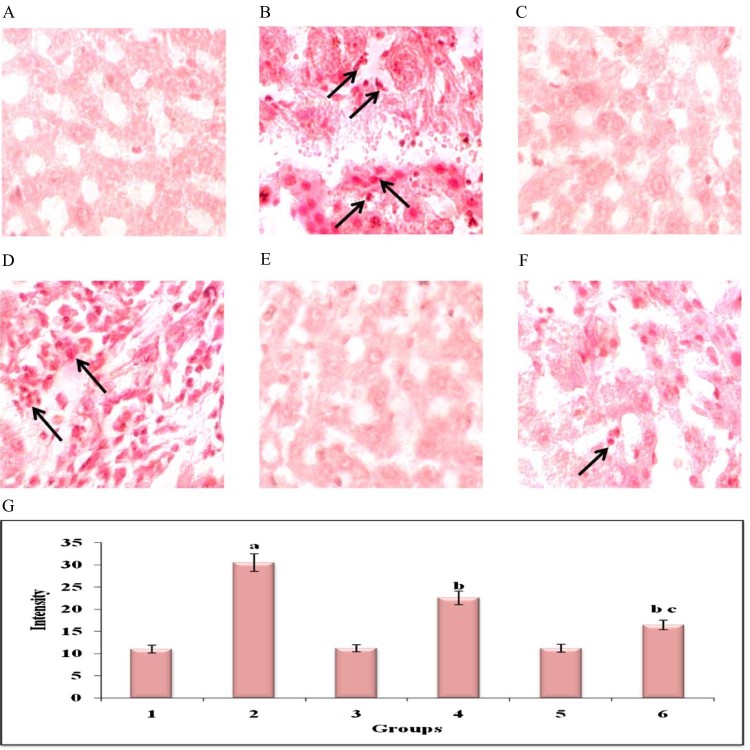
Fig. 8.
Histochemical analysis of Glycoconjugates by PAS staining in the liver of control and experimental groups of animals (40×). Plate's a–f corresponds to the liver sections of groups 1–6, respectively, (A) Control group. (B) DEN-induced group. (C) Hesperetin alone treated group. (D) DEN + hesperetin treatment group. (E) Au-mPEG(5000)-S-HP NPs alone treated group. (F) DEN + Au-mPEG(5000)-S-HP NPs treated group. (G) Quantitative analysis of intensity of staining for glycoconjugates. Arrow depicts glycoconjugates expression.

