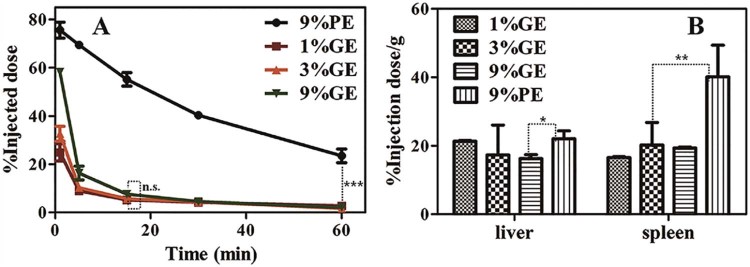
Fig. 2.
The pharmacokinetic profiles and organ distributions of intravenous injected nanoemulsions (1%GE, 3%GE, 9%GE and 9%PE) at the dose of 5 µmol phospholipid/kg in rats, n = 3. (A) Plasma concentration of the PE/GE. (B) Tissue concentration of the PE/GE. Each value represents the mean ± SD of three animals. n.s. P > 0.05, *P < 0.05, **P < 0.01, ***P < 0.005.

