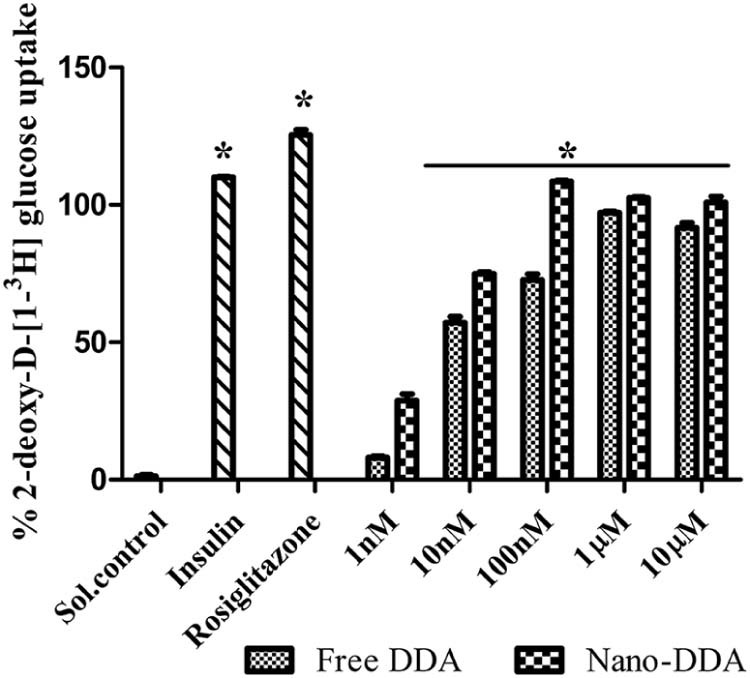
Fig. 6.

Comparative analysis of free DDA and nano-DDA on 2-deoxy-D-[1-3H] glucose uptake. The results were expressed as percentage glucose uptake with respect to the control. The solvent control showed 1.36 ± 1.45% glucose uptake. The positive controls (Rosiglitazone (50 µM) and Insulin (100 nM)) exhibited 110.04 ± 0.21%, 125.41 ± 1.84% glucose uptake respectively. The values are expressed as mean ± SD, n = 3 in duplicates. (*) P < 0.05 as compared with control.
