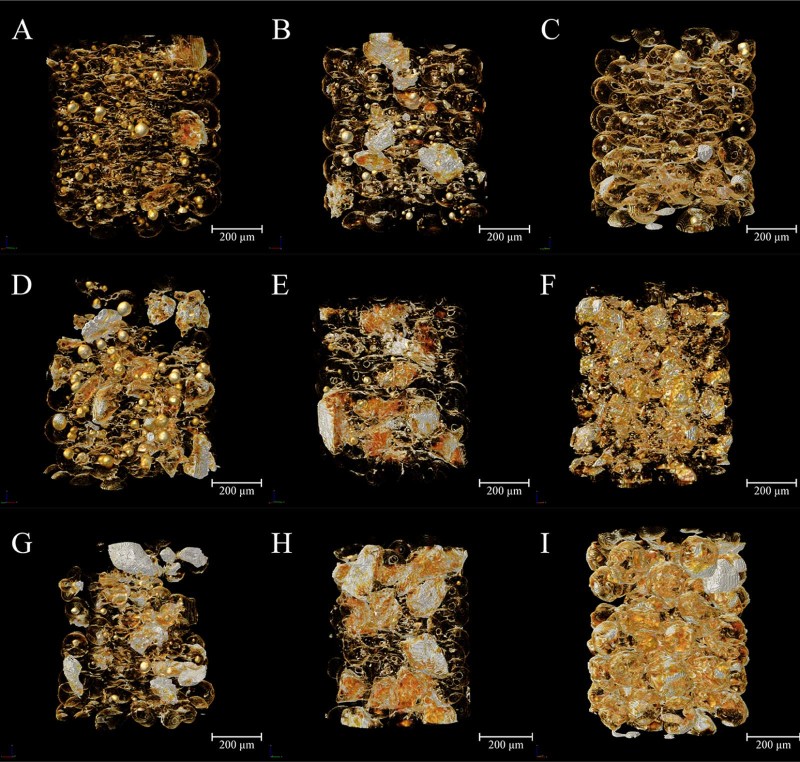
Fig. 5.
The 3D distribution characteristics of sucrose ester extracted from the reconstructed 3D images of microspheres based on inversed intensity extraction method. The concentration of sucrose stearate was 1%, and Eudragit was 4.5% (A), 7.5% (B), and 10.5% (C), respectively; the sucrose stearate was 4%, and Eudragit was 4.5% (D), 7.5% (E), and 10.5% (F), respectively; the sucrose stearate was 7%, and the Eudragit was 4.5% (G), 7.5% (H), and 10.5% (I), respectively. The color map ranges from red to white, and passes through the colors orange and yellow, representing the density from low to high.

