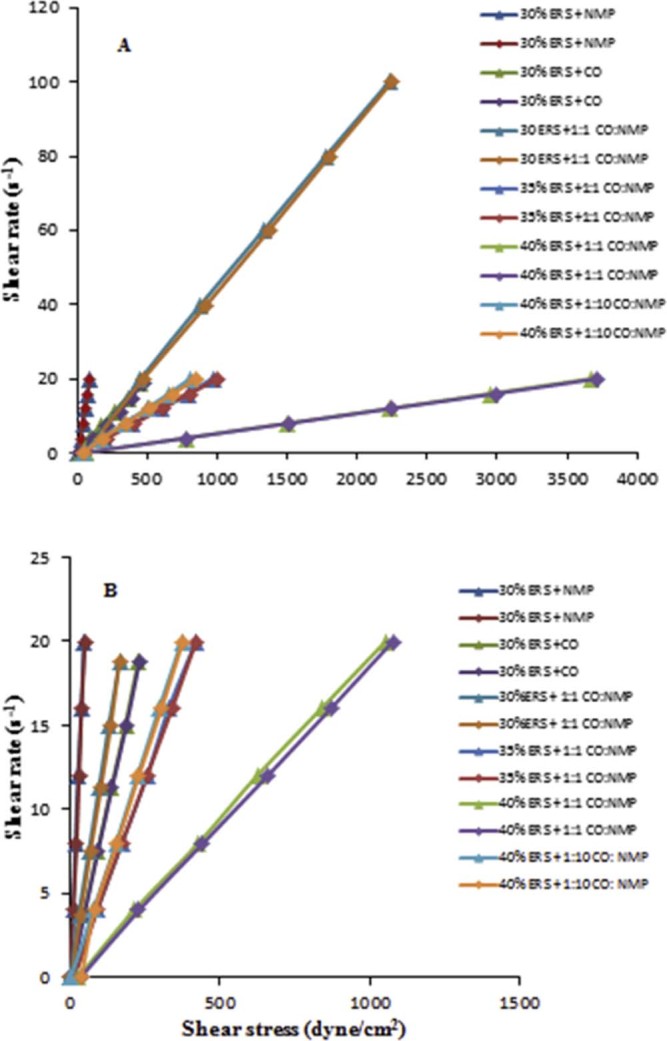
Fig. 2.

Flow curve of DH-loaded solvent exchange induced-ERS ISGs at (A) 25 °C and (B) 37 °C. Triangle ( ) represent the up-curves, and the diamond (
 ) represents the down-curve.

Flow curve of DH-loaded solvent exchange induced-ERS ISGs at (A) 25 °C and (B) 37 °C. Triangle ( ) represent the up-curves, and the diamond (
 ) represents the down-curve.