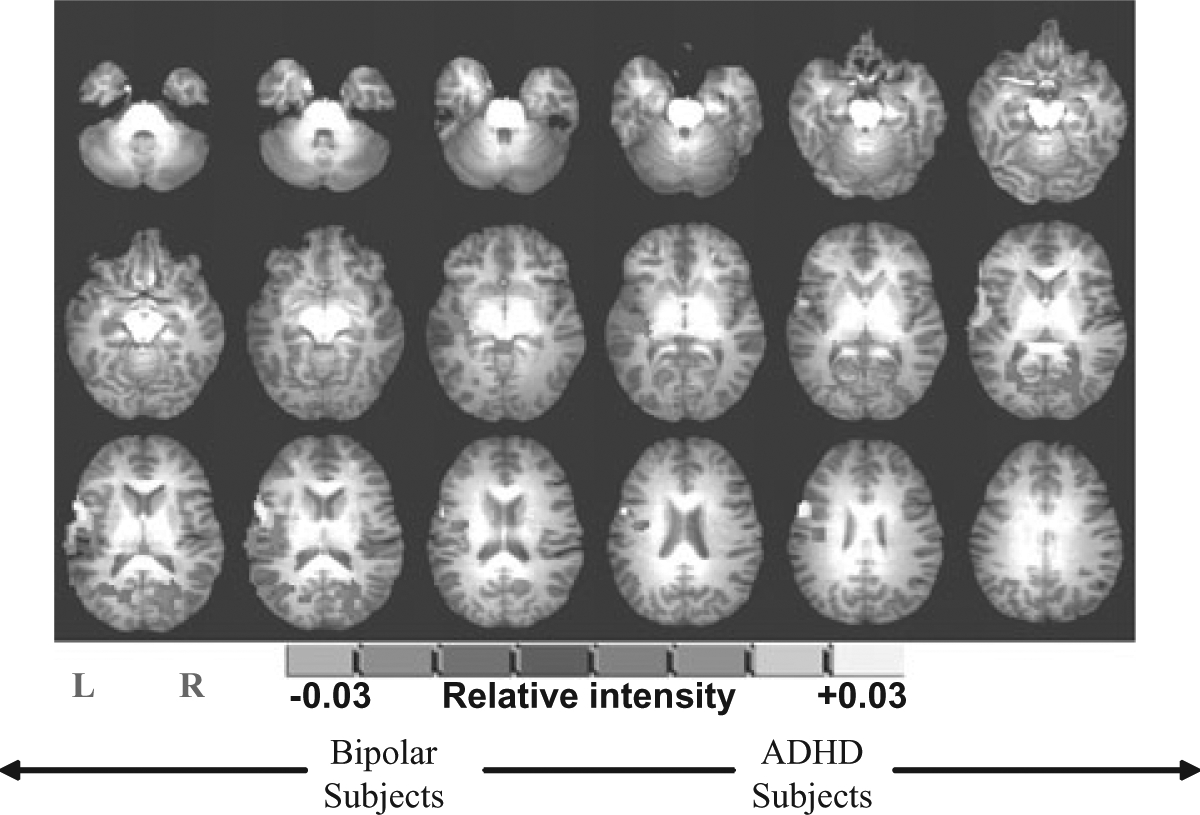
FIGURE 1.

Functional activation map showing relative brain activation during response inhibition between patients with attention-deficit hyperactivity disorder (ADHD) and bipolar disorder (all regions were significant at P ≤ 0.05). Orange areas represent significantly greater brain activation in ADHD subjects.
