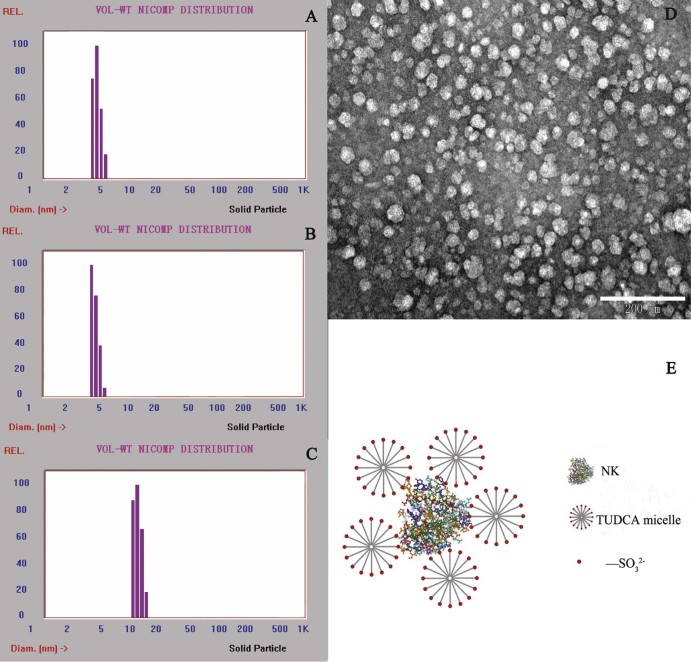
Fig. 6.
The Nicomp diagram of the particle size distribution of NK (10 kIU/ml; pH 5.0) (A), TUDCA (TUDCA: 10 mg/ml; pH 5.0) (B), NK-TUDCA (NK: 10 kIU/ml, TUDCA: 10 mg/ml; pH 5.0) (C), the morphology of NK-TUDCA (NK: 10 kIU/ml, TUDCA: 10 mg/ml; pH 5.0) by TEM (scale bar, 200 nm) (D), and the schematic depiction of NK-TUDCA (E).

