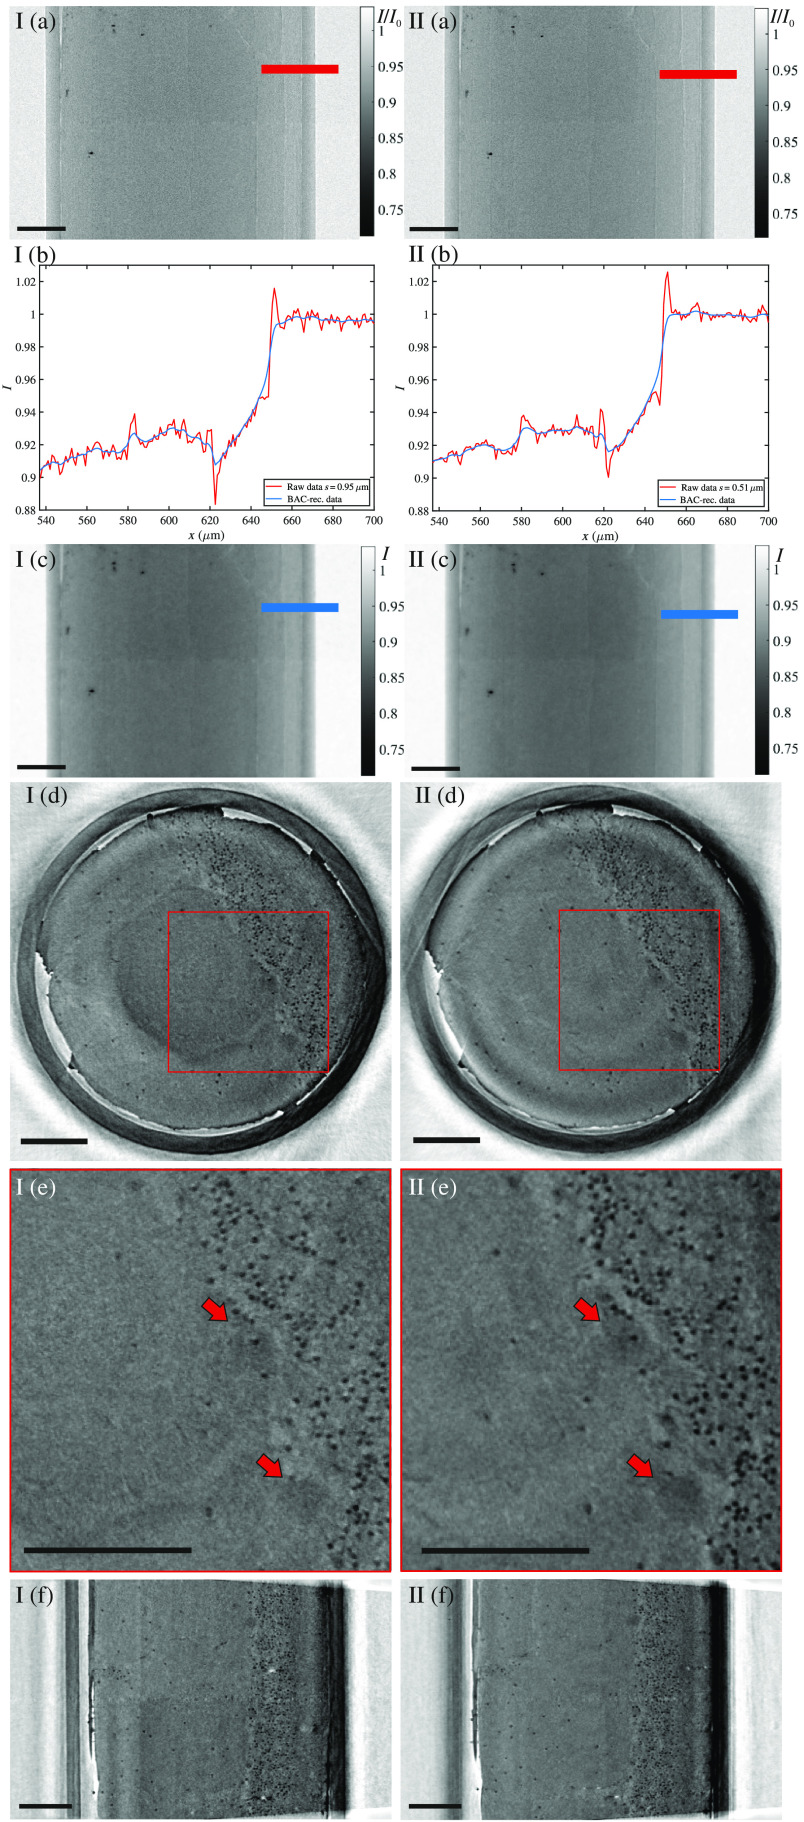
Fig. 4.
Data from tomography scans at fixed Fresnel number of 2.0, at (I) () and (II) (). (a) Respective flat-field-corrected projections and (c) BAC-reconstructed projections. Colored bars indicate the position of the profiles shown in (b). The same virtual slice (d) in the plane with a zoom-in in (e) and (f) in the plane. Red arrows mark PCs. Data from quantitative analysis are summarized in Table 1. Scale bars: .

