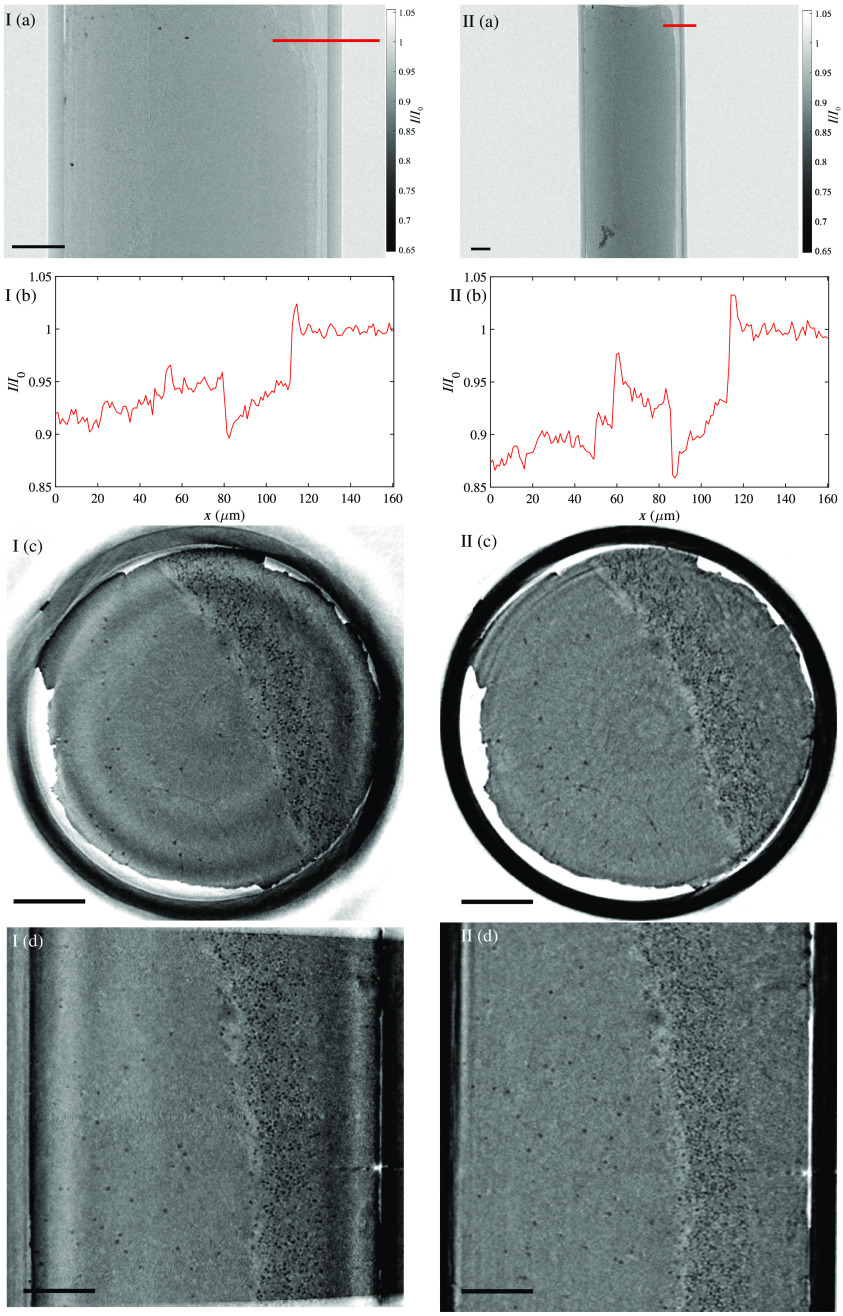
Fig. 6.
Comparison of (I) nanotube tomography with (II) microfocus rotating-anode results. Settings were chosen such that same for both data sets. (a) Flat-field-corrected projections. The colored bars show the position of the intensity profile plots in (b). Note the identical ranges of the axis. Virtual slices through the same position in the reconstructed sample volume are shown in (c) for the plane and (d) the plane. Scale bars: .

