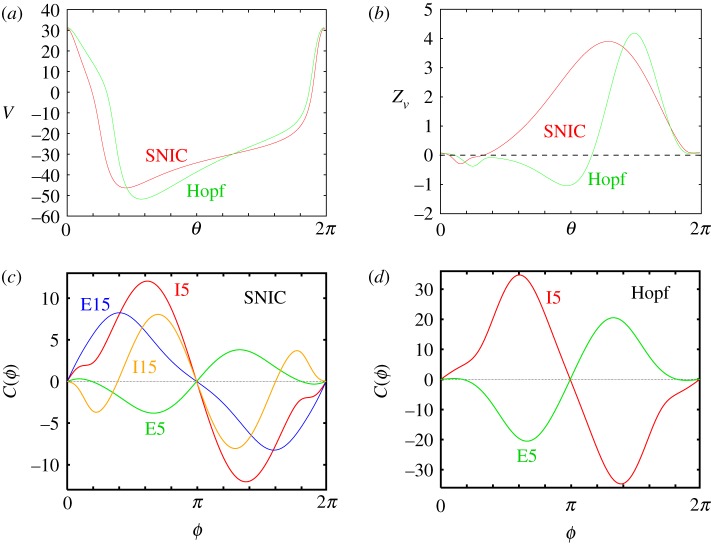
Figure 1.
The Morris Lecar Model. (a) The voltages for parameters near an SNIC or Hopf bifurcation. (b) The solutions to the adjoint equation in each case. (c) The interaction functions C(ϕ) in different scenarios for the SNIC. E (I) excitatory (inhibitory) and τ = 5, 15 ms; so E15 is excitatory with τ = 15, e.g. (d) Same as (c) for the Hopf scenario; τ = 15 differs only in the amplitudes and is not shown. (Online version in colour.)

