Figure 6:

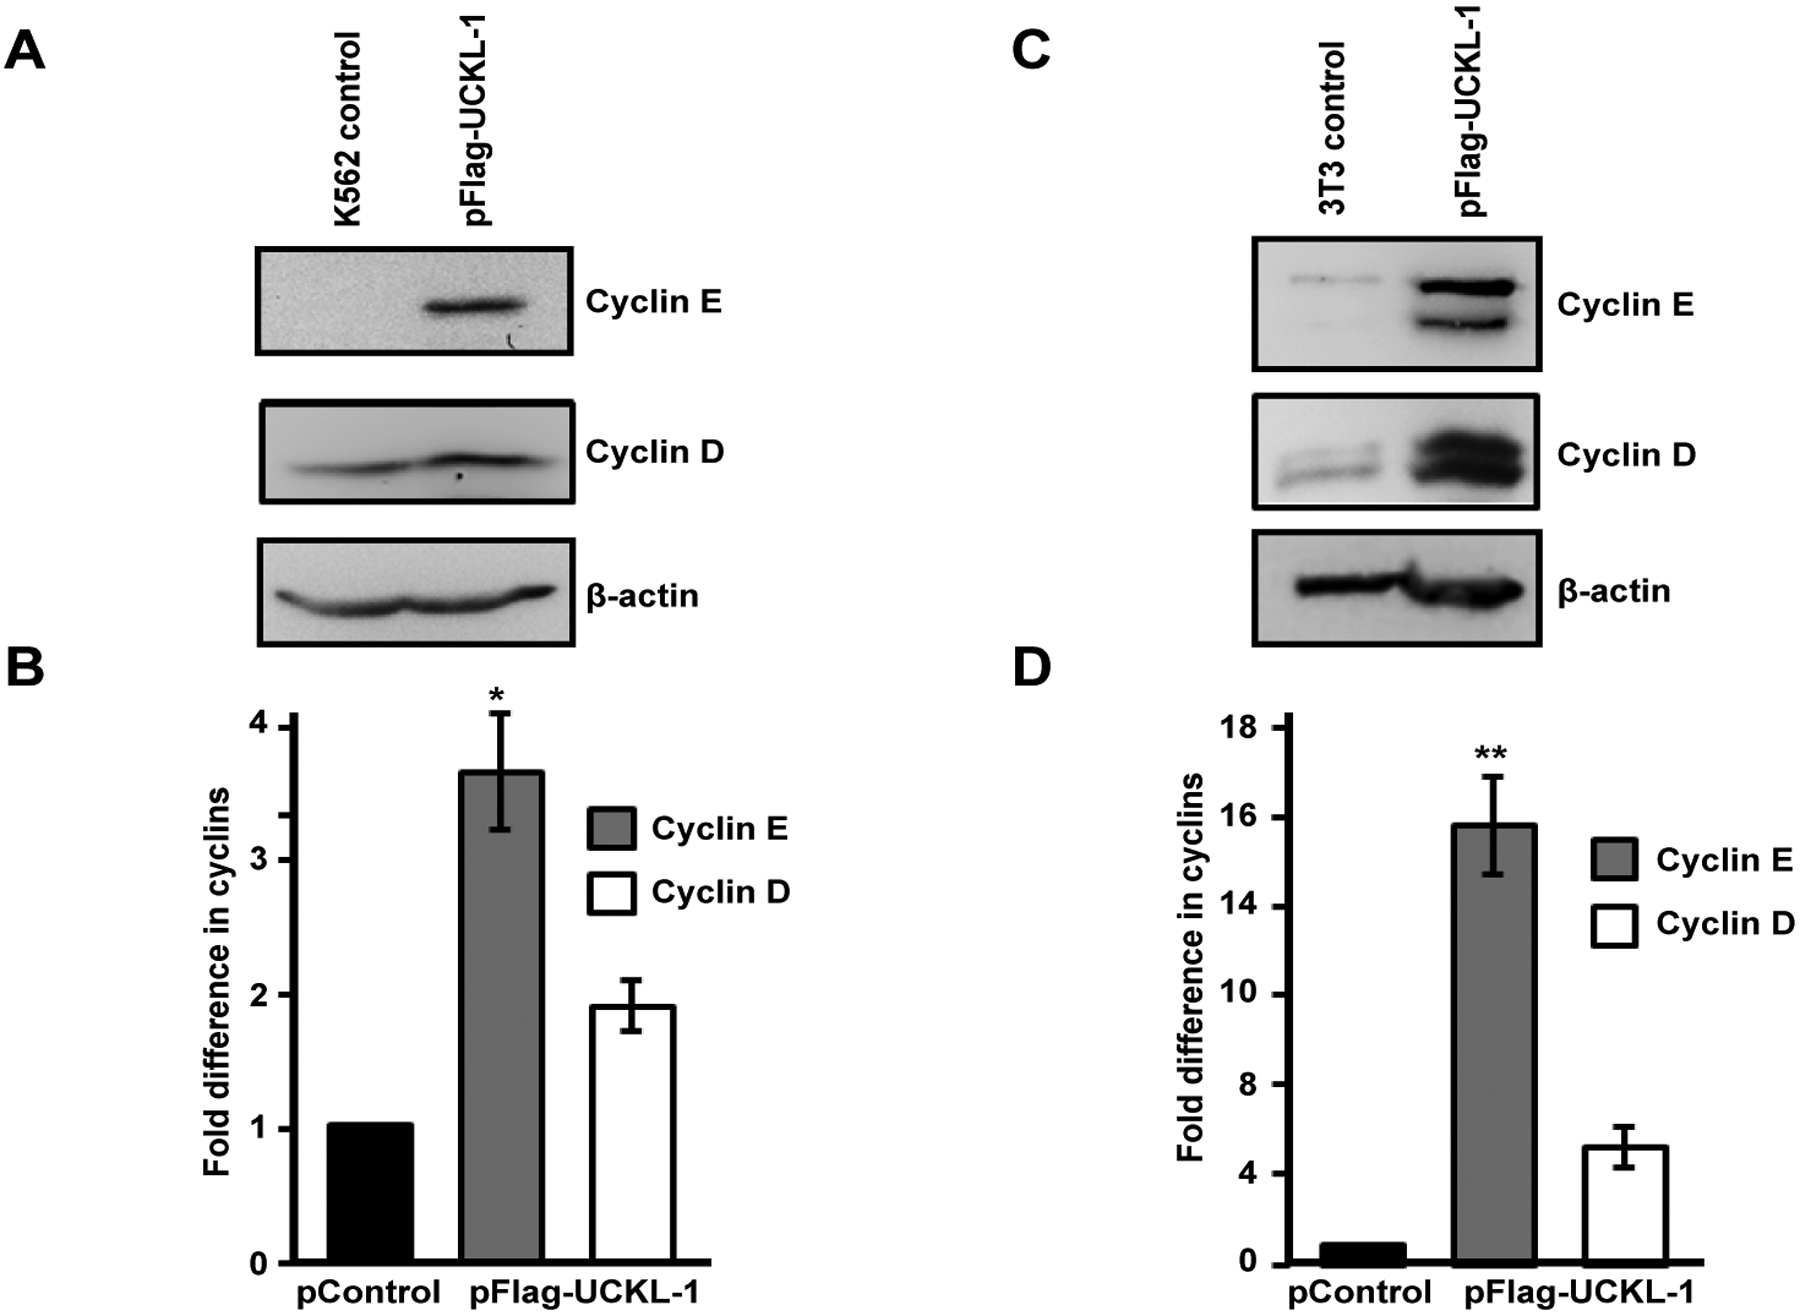
Effect of UCKL-1 over-expression on cyclin D and cyclin E levels. (a & b) K562 cells were nucleofected with either pFlag-UCKL-1 or pControl and cell lysates were analyzed for cyclin D, cyclin E and β-actin expression 20 hours later. A representative blot is shown in (a); (b) Cyclin D and cyclin E levels in K562 cells were quantitated from immunoblots from four replicate experiments. Bands were analyzed by densitometry and cyclin levels were normalized to β-actin. Results are expressed as the fold increase in cyclin expression, with the levels in pControl-transfected K562 cells set to one (*p = 0.002); (c & d) Cell lysates from 3T3 cells transfected with pFlag-UCKL-1 or pControl were analyzed for cyclin D, cyclin E and β-actin expression. A representative blot is shown in (c); (d) Cyclin D and cyclin E levels were quantitated from immunoblots from three experiments. Bands were analyzed by densitometry and cyclin levels were normalized to β-actin. Results are expressed as the fold increase in cyclin expression, with the levels in pControl-transfected 3T3 cells set to one (**p = 0.006).
