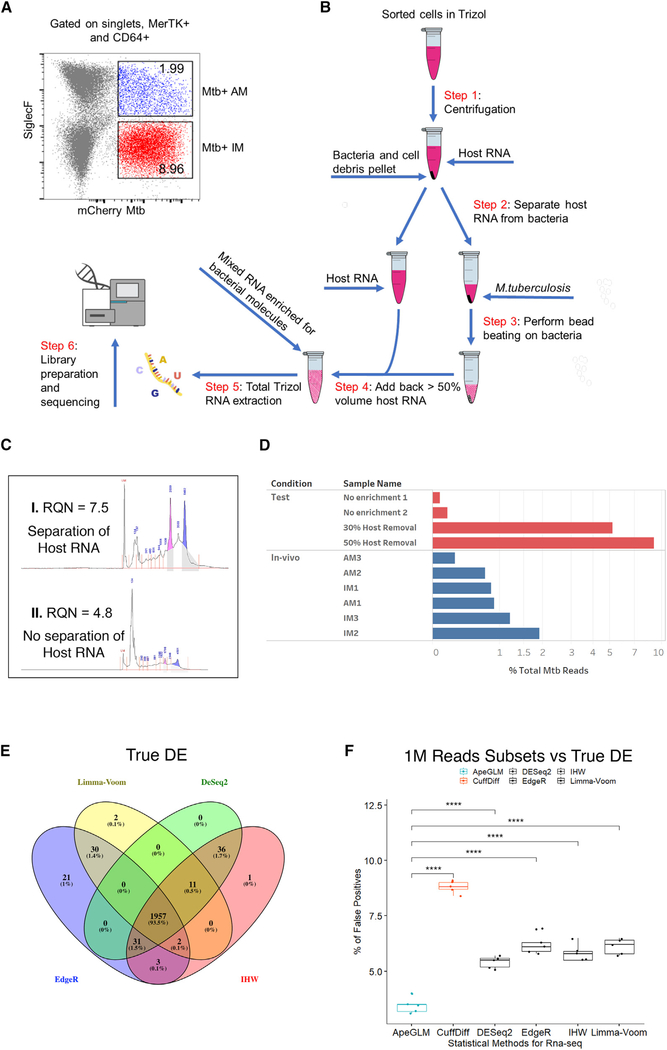
Figure 1. In Vivo Dual RNA-Seq Pipeline for the Enrichment of Bacterial RNA from Flow-Sorted Lung Macrophages.
(A) Flow gating strategy used to identify the two different lung macrophages lineages. CD64+ and MerTk+ macrophages were separated from the rest of the immune population and the AM and IM lineages identified by the level of expression of Siglecf. IM- and AM-infected macrophages constituted ~9% and ~2%, respectively, of the total macrophage population. The experimental infection and cellular isolation was repeated three times independently (n = 3), each time pooling and processing lung tissue from three infected mice.
(B) Diagram of the RNA extraction process. Samples were sorted in Trizol to release host RNA and pelleted, and the supernatant (containing most of the host RNA) was removed and placed aside. Fresh Trizol was added to the tube containing the bacterial pellet, and the bacteria were disrupted through mechanical lysis. A percentage of the host RNA (nominally 50%) was then transferred back to the tube containing the lysed bacteria and the resulting total RNA, now enriched for bacterial transcripts, processed following the Trizol protocol.
(C) Example of an Agilent Bioanalyzer 2100 plot shows how physical separation of the host RNA from the bacterial pellet prior Mtb homogenization preserves RNA quality and integrity, as evidenced by the intact rRNA peaks and higher quality score (RNA quality number [RQN] 7.5 versus 4.8).
(D) Bar chart illustrating the percentage of total reads that map to the Mtb Erdman genome for the test and in vivo samples.
(E) Venn diagram showing the overlap of the genes (abs[log2 FC > 1], false discovery rate [FDR] < 0.05) detected as differentially expressed on the full reference datasets by DESeq2, IHW, edgeR, and limma-voom. We nominally defined this set of genes as “true DE.”
(F) Percentage of false positives (genes detected as differentially expressed; abs[log2 FC > 1], FDR < 0.05) in the subset of 1 M reads but not part of “true DE”) for the most common used statistical approaches in RNA-seq analysis. APEGLM outperformed all other methods, with a false-positive rate of <3.5%. p values were calculated using one-way ANOVA followed by Tukey’s post hoc test.

