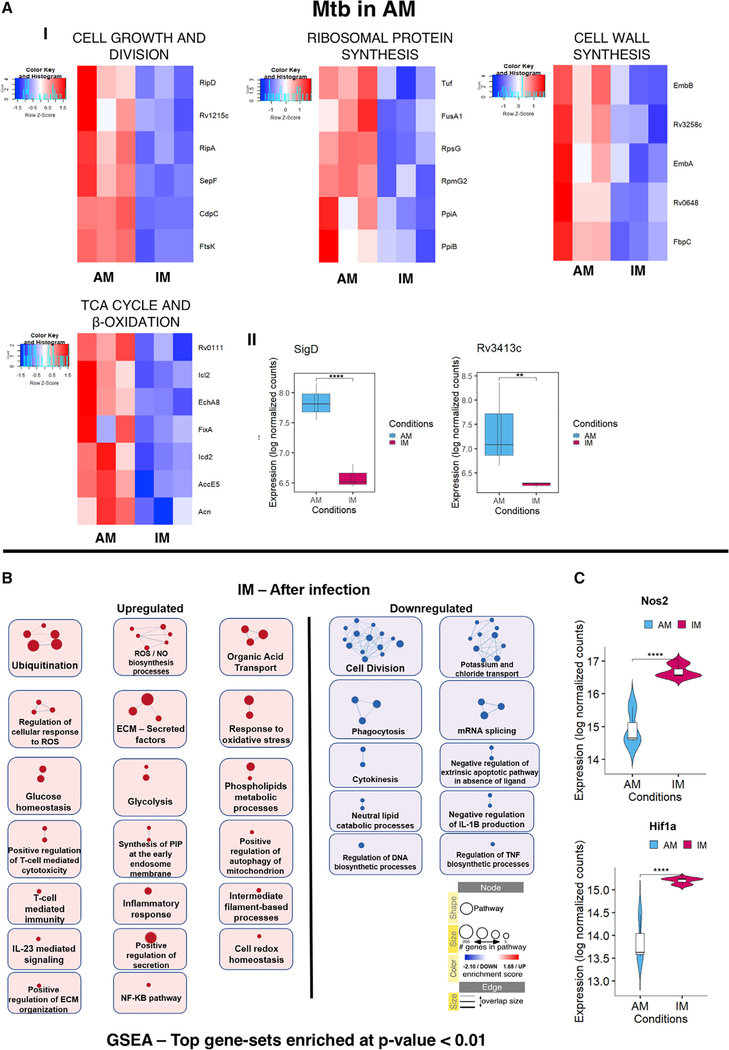
Figure 5. Transcriptional Signatures Specific to Mtb in AM and Enrichment map for the Infected versus Uninfected IMs.
(A) (I) Heatmaps showing relative expression levels for genes related to cell growth and division, ribosomal protein synthesis, cell wall synthesis, and TCA cycle and beta oxidation pathways for Mtb in AM. (II) Boxplots showing the expression levels (in log normalized counts) of the sigD and anti-sigma factor sigD (rv3413c) in Mtb.
(B) Enrichment map comparing pathways upregulated in infected versus uninfected IMs. Only GSEA gene sets with enrichment p values < 0.01 were considered in building the network.
(C) Violin plots showing the expression levels (in log-normalized counts) of the host genes Nos2 and Hif1a.
Statistical significance is provided for each plot (*p-adj. < 0.05, **p-adj. < 0.01, ***p-adj. < 0.001, and ****p-adj. < 0.0001). q values for comparisons among the groups were calculated using the Wald test as implemented in the DESeq2 pipeline.

