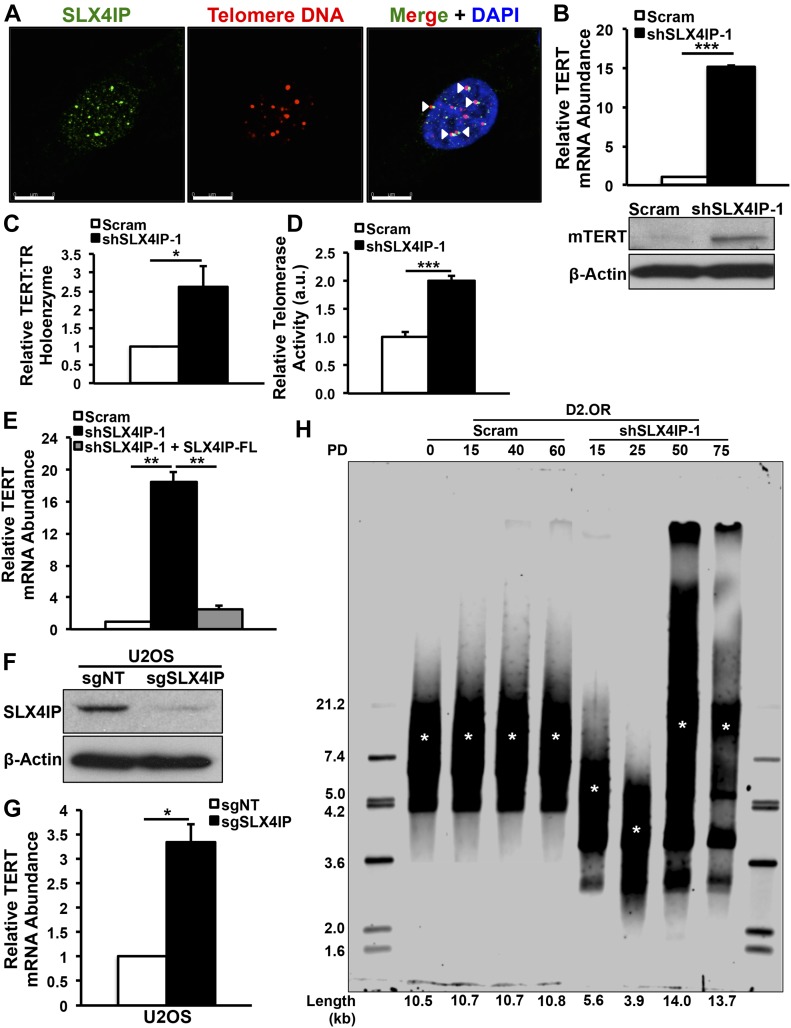
Figure 2. Altered SLX4IP expression is associated with telomerase activation.
(A) Representative IF/FISH images showing SLX4IP localization to telomeres (arrowheads) in D2.OR cells. Scale bar: 8 μm. (B) Top: qRT-PCR of TERT mRNA in the indicated D2.OR derivatives. Bottom: Immunoblot image of TERT protein abundance. n = 3 for qRT-PCR. (C) qRT-PCR of mature telomerase core holoenzyme after RNA immunoprecipitation of TERT-bound TR in specified D2.OR derivatives (n = 3). (D) Quantitation of telomerase enzyme activity in parental and SLX4IP-depleted D2.OR cells (n = 5 replicates per cell line). (E) qRT-PCR of TERT mRNA in parental, SLX4IP-depleted, and SLX4IP-reconstituted D2.OR derivatives (n = 3). (F) Representative immunoblot confirming SLX4IP knockout in U2OS cells. (G) qRT-PCR of TERT mRNA in parental and SLX4IP-null U2OS cells (n = 3). (H) Telomere restriction fragment Southern blot quantifying telomere length in parental and SLX4IP-depleted D2.OR derivatives at four distinct population doublings (PDs). Length refers to average telomere length in each lane (horizontal) or reference band size (vertical). Asterisks indicate average telomere length in each lane. (B, C, D, E, G) *P < 0.05, **P < 0.01, ***P < 0.001, Mann–Whitney U test (Panels B, C, D, and G) or Kruskal–Wallis test (Panel E).

