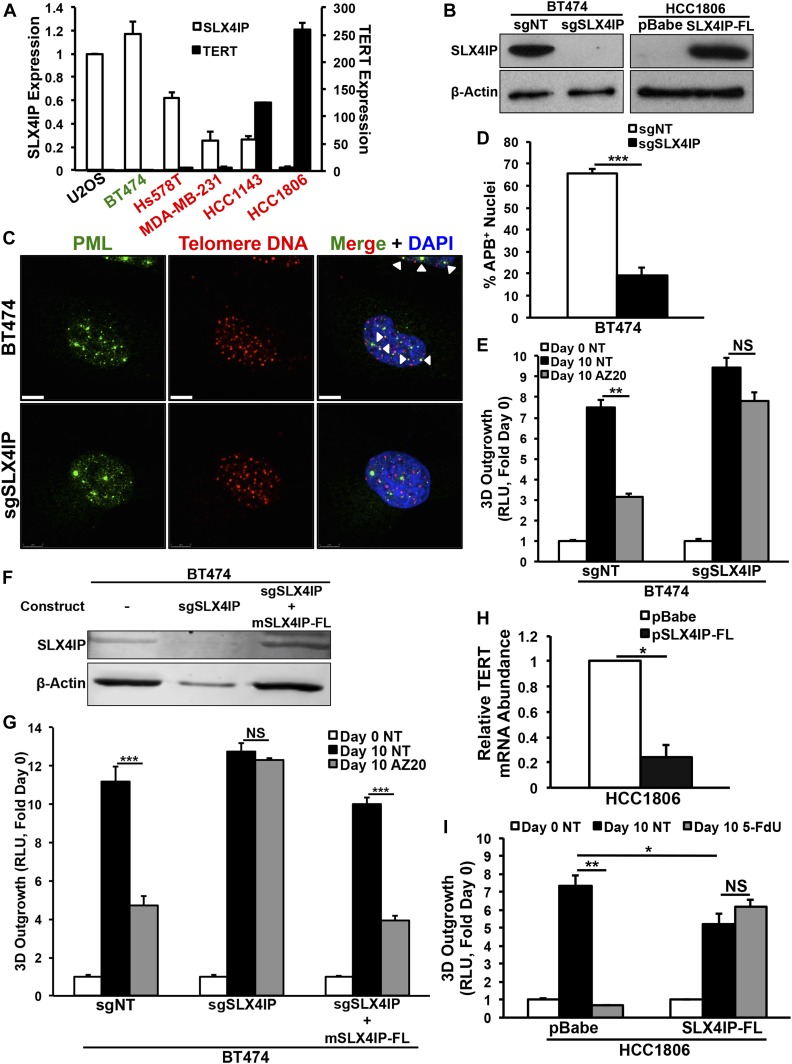
Figure 7. SLX4IP correlates with telomere homeostasis and therapeutic response in human breast cancer.
(A) qRT-PCR of SLX4IP and TERT mRNA in cell lines used in this figure. Axes display relative abundance of the indicated transcript. HER2-enriched lines are shown in green, and triple-negative breast cancer lines are shown in red (n = 3). (B) Representative immunoblots confirming SLX4IP knockout (left) or ectopic expression (right) in BT474 and HCC1806 cells, respectively. (C) Characteristic IF/FISH images illustrating presence of APBs (arrowheads) in BT474 cells and loss of these structures after SLX4IP knockout. Scale bar: 5 μm. (D) APB quantification in parental (n = 104) and SLX4IP-null (n = 124) BT474 cells, as a percentage of total nuclei observed. (E) Quantitation of 3D-outgrowth of parental and SLX4IP-null BT474 cells treated with AZ20 (150 nM) or diluent (NT; n = 4). (F) Representative immunoblot confirming ectopic expression of full-length murine SLX4IP (mSLX4IP-FL) in SLX4IP-null BT474 cells. (G) Quantitation of 3D-outgrowth of parental, SLX4IP-null, and SLX4IP-reconstituted BT474 cells treated with AZ20 (150 nM) or diluent (NT; n = 4). (H) qRT-PCR of TERT mRNA in HCC1806 cells exhibiting wild-type or overexpression of SLX4IP (n = 3). (I) Quantitation of 3D-outgrowth of parental and SLX4IP-overexpressing HCC1806 cells treated with 5-FdU (500 nM) or diluent (n = 4). (D, E, G, H, I) *P < 0.05, **P < 0.01, ***P < 0.001, Mann–Whitney U test (Panels D and H) or Kruskal–Wallis test (Panels E, G, and I). NS, not significant.

