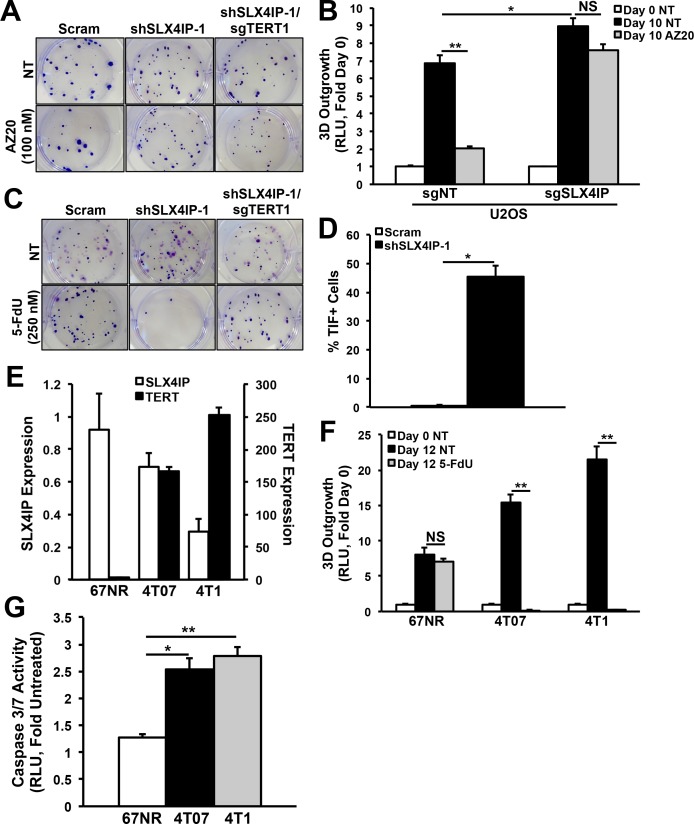
Figure S5. Efficacy of telomere maintenance mechanism-targeted therapy in cancer cells exhibiting differential SLX4IP and TERT expression.
(A) Representative images of Crystal violet–stained D2.OR colonies treated with AZ20 (100 nM; 72 h) or diluent (NT), followed by a 7 d recovery in regular growth media. (B) Quantitation of 3D-outgrowth of parental and SLX4IP-null U2OS cells treated with AZ20 (200 nM; 10 d) or diluent (n = 4). (C) Representative images of Crystal violet–stained D2.OR colonies treated with 5-FdU (250 nM; 72 h) or diluent. (D) TIF quantification in 5-FdU-treated (250 nM; 72 h) parental (n = 484) and SLX4IP-depleted (n = 785) D2.OR derivatives, as a percentage of total nuclei observed. The cells were called TIF+ if they contain ≥3 TIFs. (E) qRT-PCR of SLX4IP and TERT mRNA in 67NR, 4T07, and 4T1 cells (n = 3). (F) Quantitation of 3D-outgrowth of 4T1 series cells treated with 5-FdU (250 nM; 12 d) or diluent. (n = 4). (G) Quantitation of caspase-3/7 activity across members of the 4T1 series treated with 5-FdU (250 nM; 72 h), followed by a 1 d recovery in regular growth media (n = 3). *P < 0.05, **P < 0.01, Mann–Whitney U test (Panels D and F) or Kruskal–Wallis test (Panels B and G). NS, not significant.

