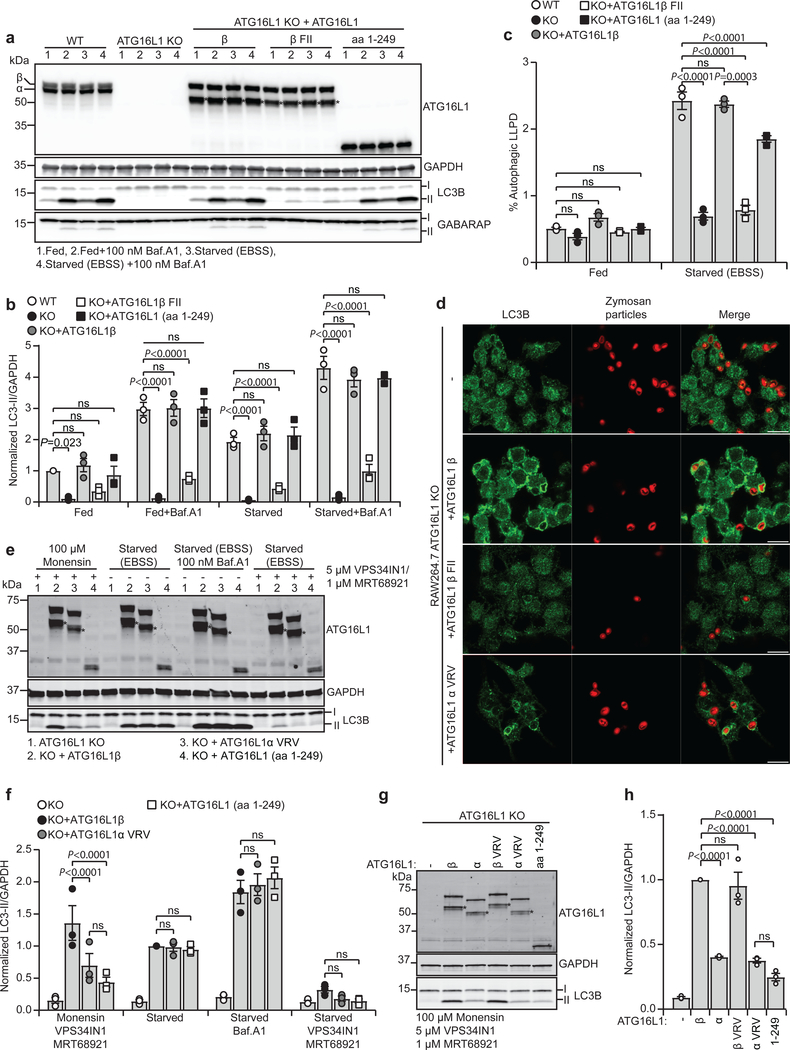
Fig. 4: Membrane binding of ATG16L1 in autophagy and during lipidation on perturbed endosomes reveals isoform specific functions.
a, LC3B/GABARAP lipidation in WT and ATG16L1 KO HEK293 cells rescued or not with ATG16L1β, ATG16L1β F32A/I35A/I36A (β FII) or ATG16L1 (aa 1–249), treated for 2 h as indicated. Cell lysates were immunoblotted against the indicated proteins. b, Levels of LC3B-II/GAPDH quantified from immunoblots in (a) and normalized to fed WT cells. c, Degradation of long-lived proteins in HEK293 WT and in ATG16L1 KO cells rescued or not with ATG16L1β, ATG16L1β F32A/I35A/I36A (β FII) or ATG16L1 (aa 1–249) was quantified based on the Baf.A1 sensitive release of 14C-valine after 4 h in indicated conditions. d, Confocal images of Zymosan-Alexa594-containing phagosomes counter-stained for LC3B in ATG16L1 KO RAW264.7 cells rescued or not with ATG16L1β, ATG16L1β F32A/I35A/I36A (β FII) or ATG16L1α V308A/R309A/V310A (α VRV). Scale bars: 10μm. The images are representative of n=2 independent experiments. e, LC3B lipidation in ATG16L1 KO HEK293 cells rescued or not with ATG16L1β, ATG16L1α V308A/R309A/V310A (α VRV) or ATG16L1 (aa 1–249). Cells were treated or not with monensin for 1 h or EBSS for 2 h in the presence or absence of Baf.A1. Co-treatment with VPS34 inhibitor VPS34IN1 and ULK1/2 inhibitor MRT68921 was performed where indicated. Cell lysates were immunoblotted against the indicated proteins. f, The levels of LC3B-II/GAPDH were quantified from immunoblots in (e) and normalized to cells rescued with ATG16L1β in the starved condition. g, LC3B lipidation in ATG16L1 KO HEK293 cells rescued or not with ATG16L1β, ATG16L1α, ATG16L1β V308A/R309A/V310A (β VRV), ATG16L1α V308A/R309A/V310A (α VRV) or ATG16L1 (aa 1–249), treated as indicated for 2h. Cell lysates were immunoblotted against the indicated proteins. h, The levels of LC3BII/GAPDH were quantified from immunoblots in (g) and normalized to cells rescued with ATG16L1β WT. All quantification in this figure are presented as mean±SEM from n=3 independent experiments. Statistical analyses were performed by Two-way Anova followed by Bonferonis multiple comparison test. Note the presence of a degradation product* upon expression of exogenous ATG16L1. Unprocessed immunoblots are shown in Supplementary Figure 4. Numerical source data can be found in Source data Suppl. Table 1.

