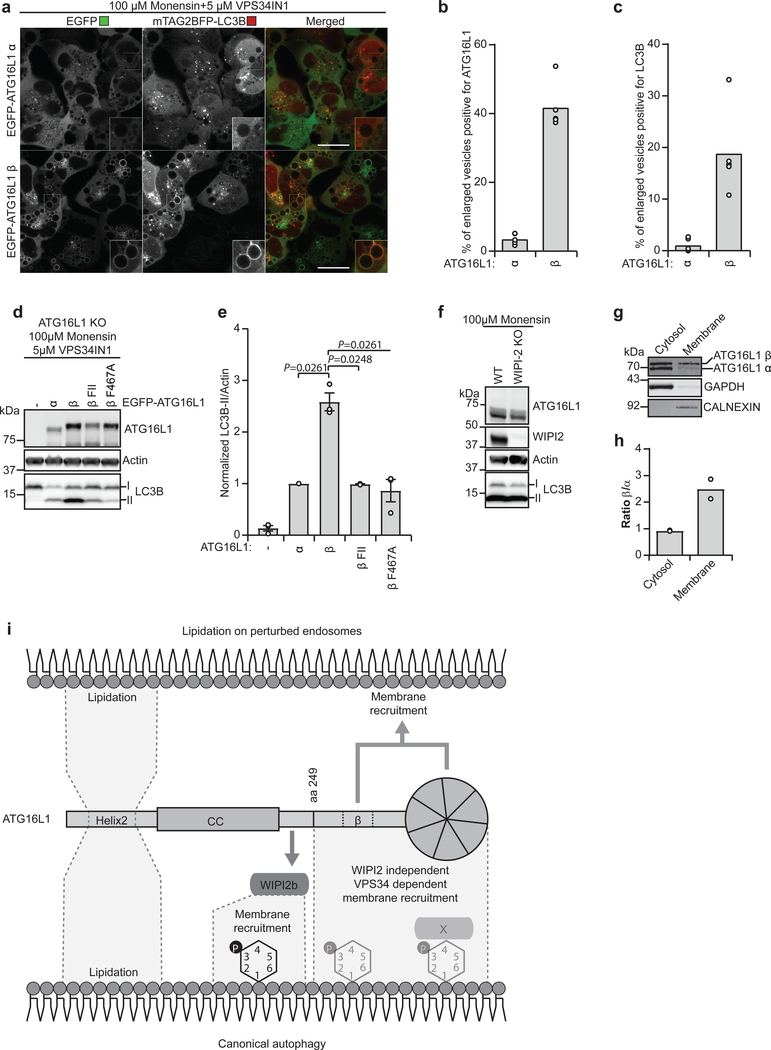
Fig. 7: The β-specific sequence in ATG16L1 is required for recruitment and LC3B lipidation on perturbed endosomes.
a, Confocal images of ATG16L1 KO HEK293 cells expressing mTAG2BFP-LC3B in addition to being rescued with EGFP-ATG16L1α or EGFP-ATG16L1β treated for 1h as indicated before live cell imaging was performed. Scale bars: 20μm. The % of enlarged vesicles in (a) positive for ATG16L1 (b) and LC3B (c) was quantified (individual data points represent single images analyzed from n=2 independent experiments, corresponding to a total of 111 and 75 cells for EGFP-ATG16L1α and EGFP-ATG16L1β, respectively). d, LC3B lipidation in ATG16L1 KO HEK293 cells rescued or not with EGFP-ATG16L1α, ATG16L1β, ATG16L1β F32A/I35A/I36A (β FII) or ATG16L1β F467A, treated for 1h as indicated. Cell lysates were immunoblotted against the indicated proteins. e, The levels of LC3B-II/Actin were quantified from immunoblots in (d) and normalized to the rescue with EGFPATG16L1α cells. The data is presented as mean±SEM from n=3 independent experiments. Statistical analyses were performed by Two-way Anova followed by Bonferonis multiple comparison test. f, WT and WIPI2 KO HEK293 cells were treated for 1 h as indicated. Cell lysates were immunoblotted against the indicated proteins. The immunoblots are representative of n=3 independent experiments. g, HeLa cells were subjected to fractionation of cytosol and membrane followed by Western blotting. h, The ratio between isoforms in cytosol/membrane fractions was quantified from immunoblot in (g) from n=2 independent experiments. i, Schematic representation of ATG16L1 domains and interactions facilitating LC3B-lipidation and membrane targeting during canonical autophagy and upon perturbation of endosomes. Unprocessed immunoblots are shown in Supplementary Figure 4. Numerical source data can be found in Source data Suppl. Table 1.

