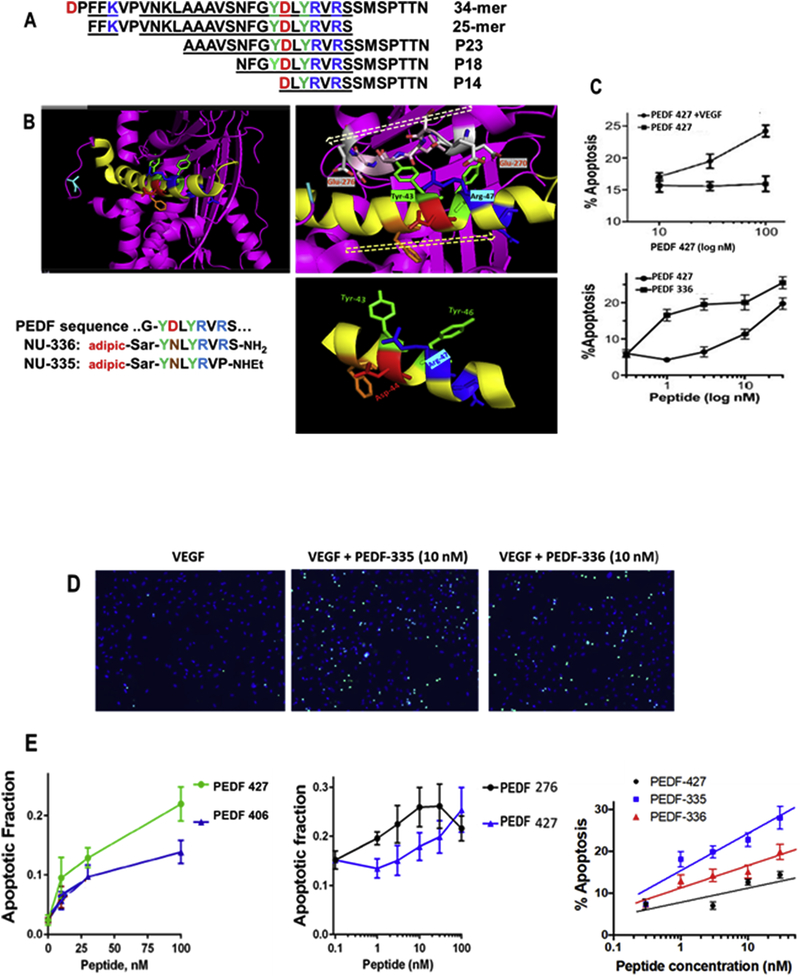
Figure 1. Secondary structure and mimicry of PEDF N-terminal 34-mer peptide.
(A) The active anti-angiogenic, largely α-helical 34-mer extends from Asp-24 to Asn-56 of PEDF (Filleur et al., 2005). An active N-terminal 25-mer therein bound tightly to 67LR (Bernard et al., 2009), and more distal 23-mer and 18-mer (P18) fragments have also been shown active, although a 14-mer starting at Asp44 was inactive (Mirochnik et al., 2009). Amino acid sequences are shown with positively charged residues in blue, negative residues red and Tyr in green, with shaded alpha-helical span from Asn32 through Ser52. (B) The PEDF x-ray crystal structure Protein Data Base PDB ID 1IMV, (Simonovic et al., 2001) is shown as ribbon backbone, the above region highlighted yellow. It is then enlarged from N32-S52, hashed arrow left-to-right tracing N-to-C direction. This reveals Arg47 accessible to solvent, with Tyr43 partially overlaid by residues 270–276 (EESKLTSE, hashed arrow right-to-left N-to-C direction) in a disordered segment, likely able to move, allowing Tyr43 solvent access. Bottom right panel is the Asn39 to Met51 portion where side chains of Tyr43 and Arg47 are seen on the same helical face, replicated in synthetic peptides shown. (C) Apoptosis assay, as described in section 2.7, shows VEGF requirement, also peptide concentration dependence indicates PEDF 336 improvement over PEDF 427. D) EC apoptosis was detected by in situ TUNEL (green), cell nuclei highligfhted by DAPI (blue) with representative images of EC apoptosis shown. Quantitative analysis performed using Nikon Elements software and percent apoptotic cells calculated for each treatment. A minimum of 8 field per condition (100–300 cells per field) were analyzed. (E) Linear regression plots were generated using Prizm 6 software package. Pairwise and 3-peptide simultaneous comparisons are shown as concentration dependence, leading to the potency ranking in Table 1. Statistical significance was determined using multiple T test (P<0.0001).

