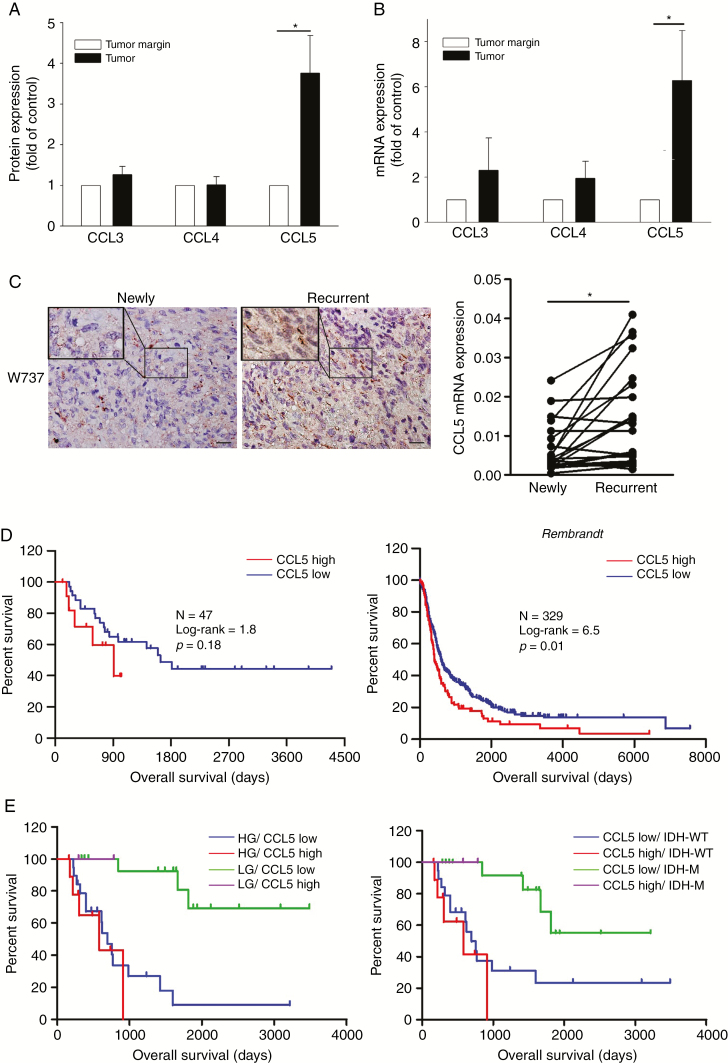
Fig. 1.
Survival analysis results for CCL5 in newly diagnosed glioma. (A) CCL5 expression quantified from 4 newly diagnosed GBM tissues. (B) The CCL5 mRNA expression of newly diagnosed gliomas (n = 15) relative to the tumor margin was determined. (C) IHC staining of CCL5 (brown) in paired newly diagnosed and recurrent GBM tumor sections. CCL5 mRNA identified in paired newly diagnosed (n = 20) and recurrent GBM (n = 20) tumors. (D) Kaplan–Meier survival plots for glioma patients with a low CCL5 level (low = 12, high = 35) showed a longer OS. Using the REMBRANDT database, Kaplan–Meier survival plots confirmed a survival advantage in the patients with a low CCL5 level (low = 83, high = 246). (E) Glioma patients (n = 47) were stratified based on CCL5, grading, and IDH status. LG: low-grade; HG: high-grade; IDH-M: mutant IDH. Bar: 100 µm. All data are presented as means ± SE. *P < 0.05, #P < 0.01.

