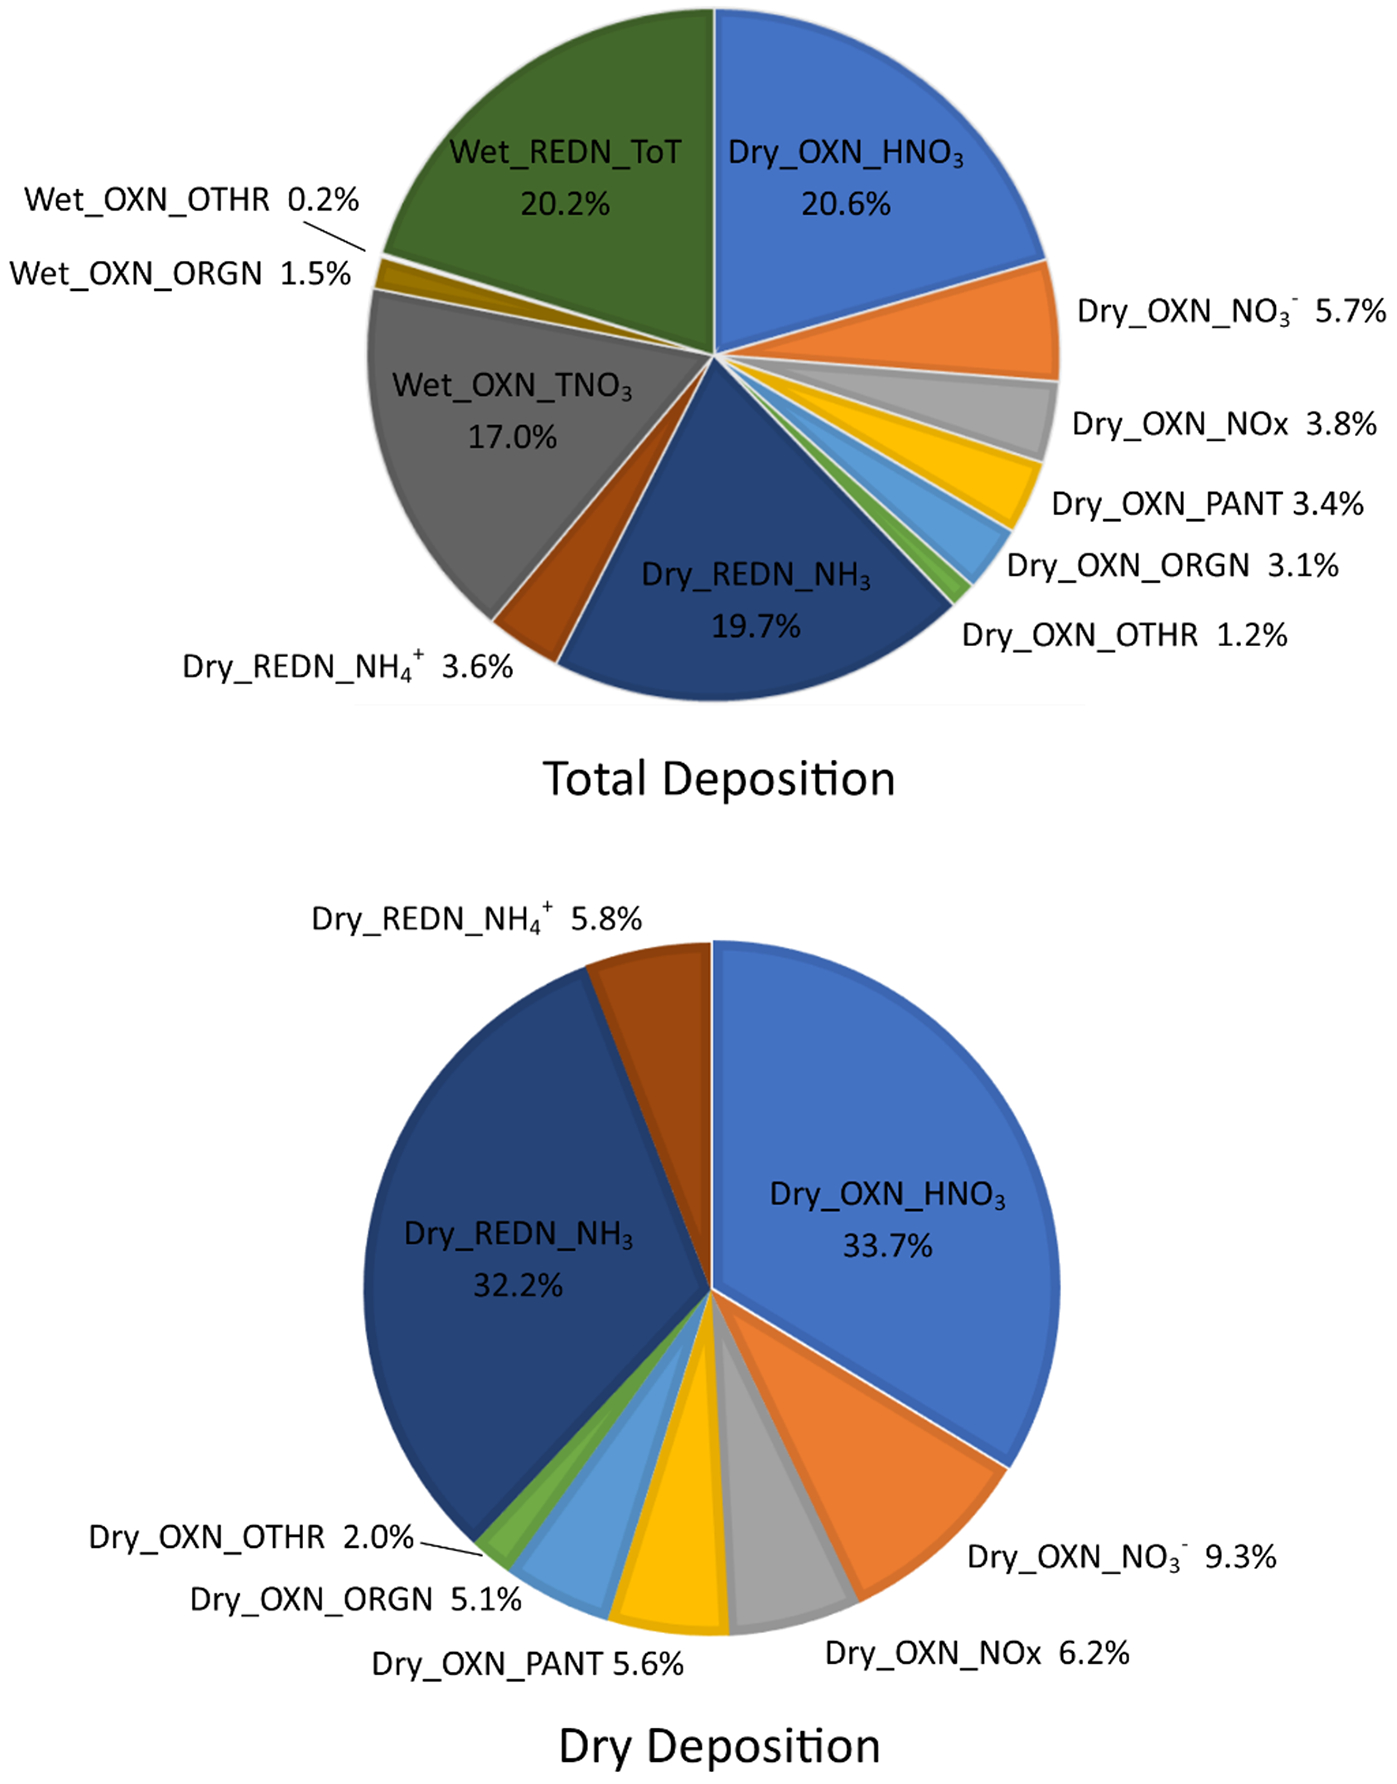
Figure 1.

Nr deposition budget for the continental U.S. for 2015 (CMAQ V5.2.1). The top pie is the total Nr budget. Bottom pie is dry deposition only. The depositing species are categorized by wet versus dry deposition and oxidized (OXN) versus reduced (REDN) forms of nitrogen.
