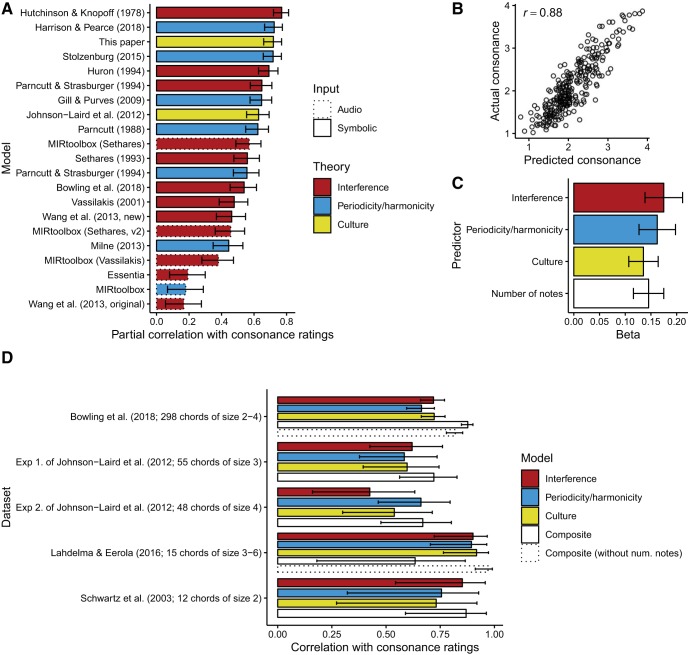
Figure 2.
Results of the perceptual analyses. All error bars denote 95% confidence intervals. (A) Partial correlations between model outputs and average consonance ratings in the Bowling et al. (2018) dataset, after controlling for number of notes. (B) Predictions of the composite model for the Bowling et al. (2018) dataset. (C) Standardized regression coefficients for the composite model. (D) Evaluating the composite model across five datasets from four studies (Bowling et al., 2018; Johnson-Laird et al., 2012; Lahdelma & Eerola, 2016; Schwartz et al., 2003).

