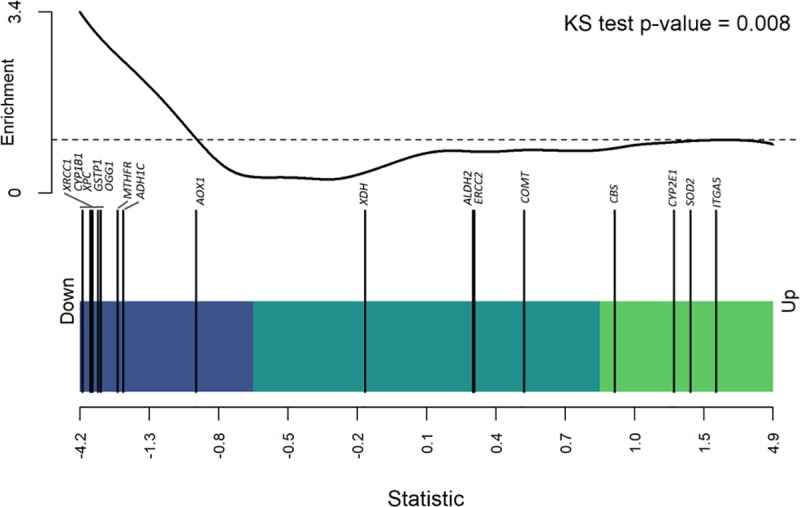
Fig 1. Gene-set enrichment analysis for gene expression across vital status.

The x-axis corresponds with the sorted effects of vital status, estimated assuming the following probabilistic model for the expression of 19,535 genes. The light green and blue rectangles represent the up and down regulation regions defined by the third and first quartile, respectively. The vertical bars represent a target set of genes involved in alcohol metabolism. The black curve shows the estimated running enrichment score, and the dashed line shows the threshold for random disposition of the target set. The p-value was obtained by modified Kolmogorov-Smirnov (KS) test over the maximum value of the enrichment score. Genes in the target set: XRCC1, CYP1B1, XPC, GSTP1, OGG1, MTHFR, ADH1C, AOX1, XDH, ALDH2, ERCC2, COMT, CBS, CYP2E1, SOD2, and ITGA5.
