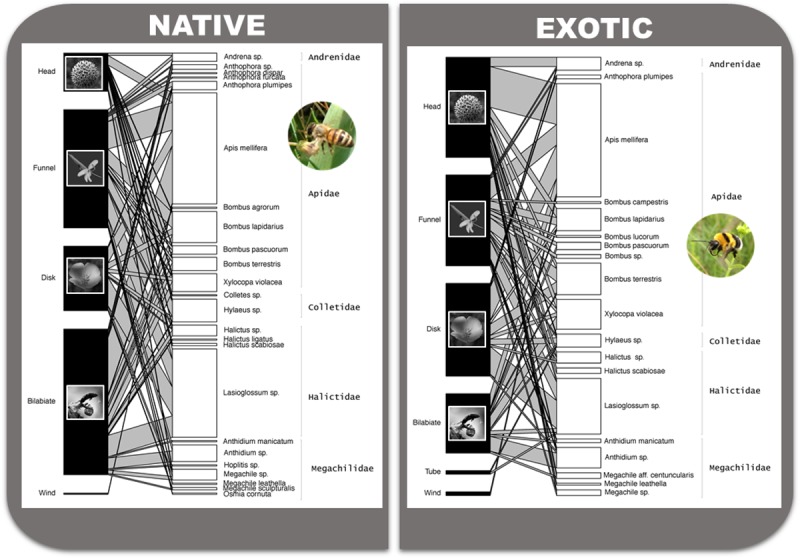
Fig 2.

Native (n = 73; A) and exotic (n = 59; B) plant–pollinator networks. Bars on the left side represent plants, grouped according to flower morphologies; bars on the right side represent bees, at species level when possible. An indication of the family to which bees belong is reported on the extreme right side of each plot, after bee (genus/species) name. Linkage width indicates the number of individuals of that bee species paying visits to plants with given flower morphology. The length of the bars for plant species represents the frequency of species with a given flower morphology. The length of the bars for the bee species represents the total number of individuals recorded for that species on all plant species combined.
