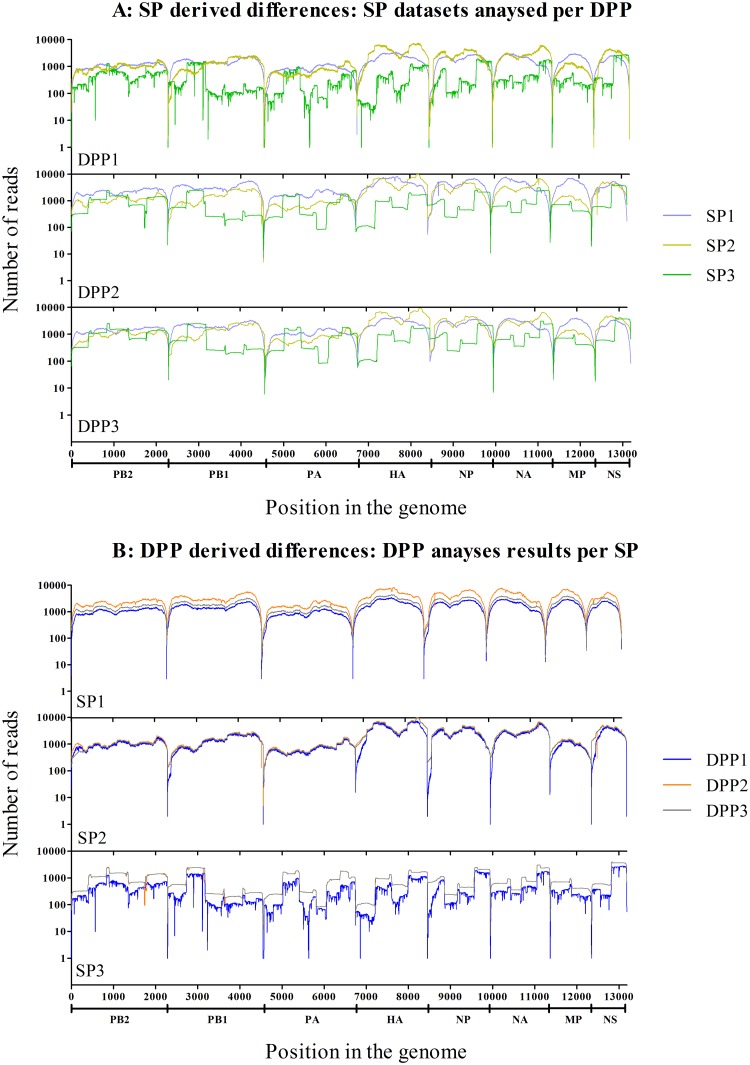
Fig 2. Nucleotide coverage.
The non-normalised nucleotide coverage displayed as number of nucleotides per position for full genome sequences of the NLCH virus reads mapped to the NLCH reference sequences. Panel A shows the coverage results for the same SP dataset in the three different DPPs (DPP1: purple; DPP2: orange; DPP3 grey) for each of the SP datasets. Panel B shows the coverage when the same DPP is used to analyse data from the three different SPs (SP1: lilac; SP2: yellow; SP3: green) for each of the DPPs. The X-axis represents the position in the genome, the Y-axis represents the number of sequence reads per position.

