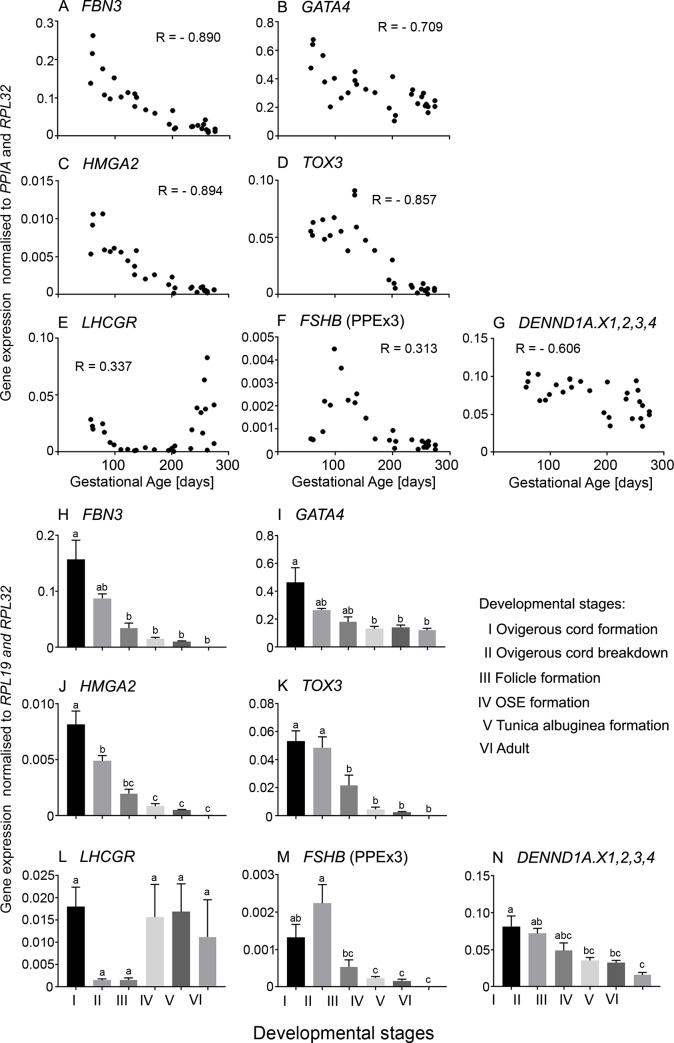
Fig 2.
A-G. Scatter plots of mRNA expression levels of PCOS candidate genes which were highly expressed during early gestation in bovine fetal ovaries (n = 27). Only the primer pair in exon 3 for FSHB amplified, whereas primers from exons 2 and 3 did not (not shown), suggesting the FSHB transcript, whilst expressed cannot encode the full length FSHB in the ovary, as expected. Pearson correlation coefficient (R) test was used to analyse data and P values are shown in Table 2. H-N. Differential mRNA expression levels in ovaries grouped into six stages of ovarian development based on their histological morphology: ovigerous cord formation (n = 7, Stage I), ovigerous cord breakdown (n = 4, Stage II), follicle formation (n = 3, Stage III), surface epithelium formation (n = 8, Stage IV), tunica albuginea formation (n = 5, Stage V) and adult (n = 6, Stage VI). Data are presented as mean ± s.e.m. (normalised to PPIA and RPL32 for scatter plot and RPL19 and RPL32 for bar graphs). One-way ANOVA with post hoc Holm-Sidak test were used to analyse the data. Bars with different letters are statistically significantly different from each other (P < 0.05).

