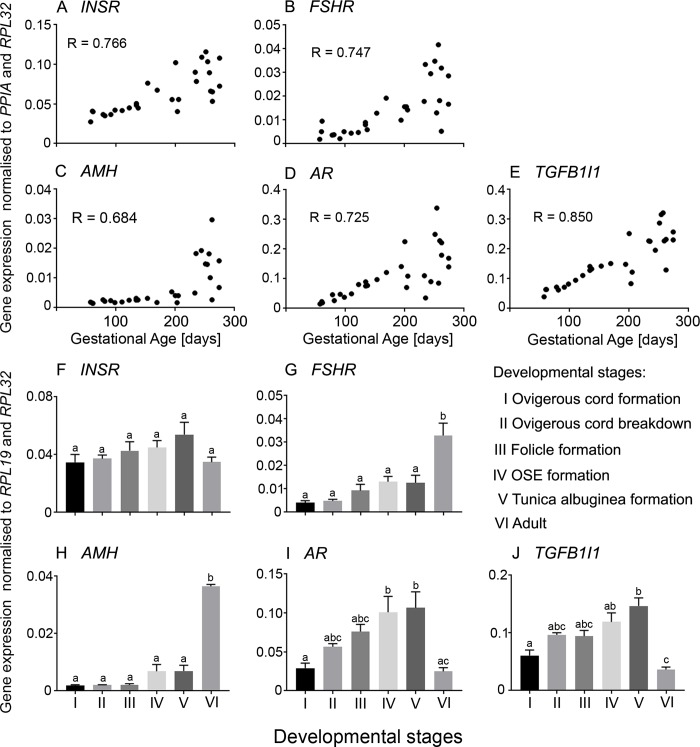
Fig 3.
A-E. Scatter plots of mRNA expression levels from genes which are highly expressed late in gestation in bovine fetal ovaries (n = 27). Pearson correlation coefficient (R) test was used to analyse data and P values are shown in Table 2. F-J. Differential mRNA expression levels in ovaries grouped into six stages of ovarian development based on their histological morphology: ovigerous cord formation (n = 7, Stage I), ovigerous cord breakdown (n = 4, Stage II), follicle formation (n = 3, Stage III), surface epithelium formation (n = 8, Stage IV), tunica albuginea formation (n = 5, Stage V) and adult (n = 6, Stage VI). Data are presented as mean ± s.e.m. (normalised to PPIA and RPL32 for scatter plot and RPL19 and RPL32 for bar graphs). One-way ANOVA with post hoc Holm-Sidak test were used to analyse the data. Bars with different letters are statistically significantly different from each other (P < 0.05).

